United Mexican States | | | 6500 | | | None |
(State or other jurisdiction of incorporation or organization) | | | (Primary Standard Industrial Classification Code Number) | | | (I.R.S. Employer Identification No.) |
Maurice Blanco Manuel Garciadiaz Drew Glover Davis Polk & Wardwell LLP 450 Lexington Avenue New York, New York 10017 +1 (212) 450-4000 | | | Juan Francisco Mendez Simpson Thacher & Bartlett LLP 425 Lexington Avenue New York, New York 10017 +1 (212) 455-2000 |
Emerging growth company ☒ | | |
| | Per ADS | | | Total | | | Per Common Share | | | Total | |
Public offering price | | | US$ | | | US$ | | | US$ | | | US$ |
Underwriting discounts and commissions(1) | | | US$ | | | US$ | | | US$ | | | US$ |
Proceeds, before expenses, to us | | | US$ | | | US$ | | | US$ | | | US$ |
(1) | See “Underwriting” for a description of the compensation payable to the underwriters. |
Barclays | | | BofA Securities | | | Morgan Stanley |
| | Page | |
| | ||
| | ||
| | ||
| | ||
| | ||
| | ||
| | ||
| | ||
| | ||
| | ||
| | ||
| | ||
| | ||
| | ||
| | ||
| | ||
| | ||
| | ||
| | ||
| | ||
| | ||
| | ||
| | ||
| | ||
| | ||
| | ||
| | ||
| | ||
| |
• | our business and strategy of investing in industrial facilities, which may subject us to risks of the sector in which we operate but uncommon to other companies that invest primarily in a broader range of real estate assets; |
• | our ability to maintain or increase our rental rates and occupancy rates; |
• | the performance and financial condition of our tenants; |
• | our expectations regarding income, expenses, sales, operations and profitability; |
• | our ability to obtain returns from our projects similar or comparable to those obtained in the past; |
• | our ability to successfully expand into new markets in Mexico; |
• | our ability to successfully engage in property development; |
• | our ability to lease or sell any of our properties; |
• | our ability to successfully acquire land or properties to be able to execute on our accelerated growth strategy; |
• | the competition within our industry and markets in which we operate; |
• | economic trends in the industries or the markets in which our customers operate; |
• | any ongoing impact from the COVID-19 pandemic and the impact of any other pandemics, epidemics or outbreaks of infectious diseases on the Mexican economy and on our business, results of operations, financial condition, cash flows and prospects, as well as our ability to implement any necessary measures in response to such impact; |
• | higher interest rates, increased leasing costs, increased construction costs, distressed supply chains for construction materials, increased maintenance costs, all of which could increase our costs and limit our ability to acquire or develop additional real estate assets; |
• | the terms of laws and government regulations that affect us, and interpretations of those laws and regulations, including changes in tax laws and regulations and changes in environmental, real estate and zoning laws; |
• | supply of utilities, principally electricity and water, and general availability of public services, to support operations in our properties and industrial parks; |
• | economic, political and social developments in Mexico, including political instability, currency devaluation, inflation, and unemployment; |
• | the performance of the Mexican economy and the global economy; |
• | the competitiveness of Mexico as an exporter of manufactured and other products to the United States and other key markets; |
• | limitations on our access to sources of financing on competitive terms; |
• | changes in capital markets that might affect the investment policies or attitude in Mexico or regarding securities issued by Mexican companies; |
• | obstacles to commerce, including tariffs or import taxes and changes to the existing commercial policies, and change or withdrawal from free trade agreements, including the USMCA, of which Mexico is a member that might negatively affect our current or potential clients or Mexico in general; |
• | increase of trade flows and the formation of trade corridors connecting certain geographic areas of Mexico and the U.S., which results in a vigorous economic activity within those areas in Mexico and a source of demand for industrial buildings; |
• | our ability to execute our corporate strategies; |
• | the growth of e-commerce markets; |
• | a negative change in our public image; |
• | epidemics, catastrophes, insecurity and other events that might affect the regional or national consumption; |
• | the loss of key executives or personnel; |
• | restrictions on foreign currency convertibility and remittance outside Mexico; |
• | changes in exchange rates, market interest rates or the rate of inflation; |
• | possible disruptions to commercial activities due to natural and human-induced disasters that could affect our properties in Mexico, including criminal activity relating to drug trafficking, terrorist activities, and armed conflicts; |
• | deterioration of labor relations with third-party contractors, changes in labor costs and labor difficulties, including subcontracting reforms in Mexico comprising changes to labor and social laws; |
• | the prices of our common shares or ADSs may be volatile or may decline regardless of our operational performance; |
• | the increased costs and disruptions to our business arising from our transformation into a public company in the United States; and |
• | other risk factors included under “Risk Factors” in this prospectus. |
| | As of September 30, | | | As of December 31, | ||||
| | 2023 | | | 2022 | | | 2021 | |
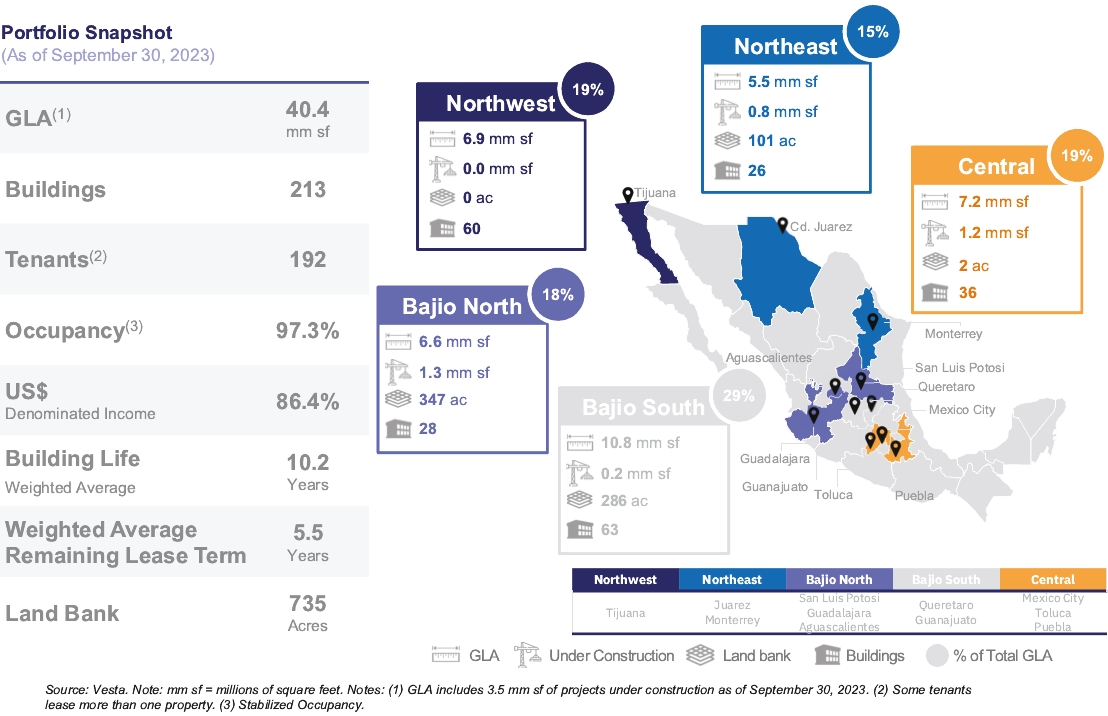
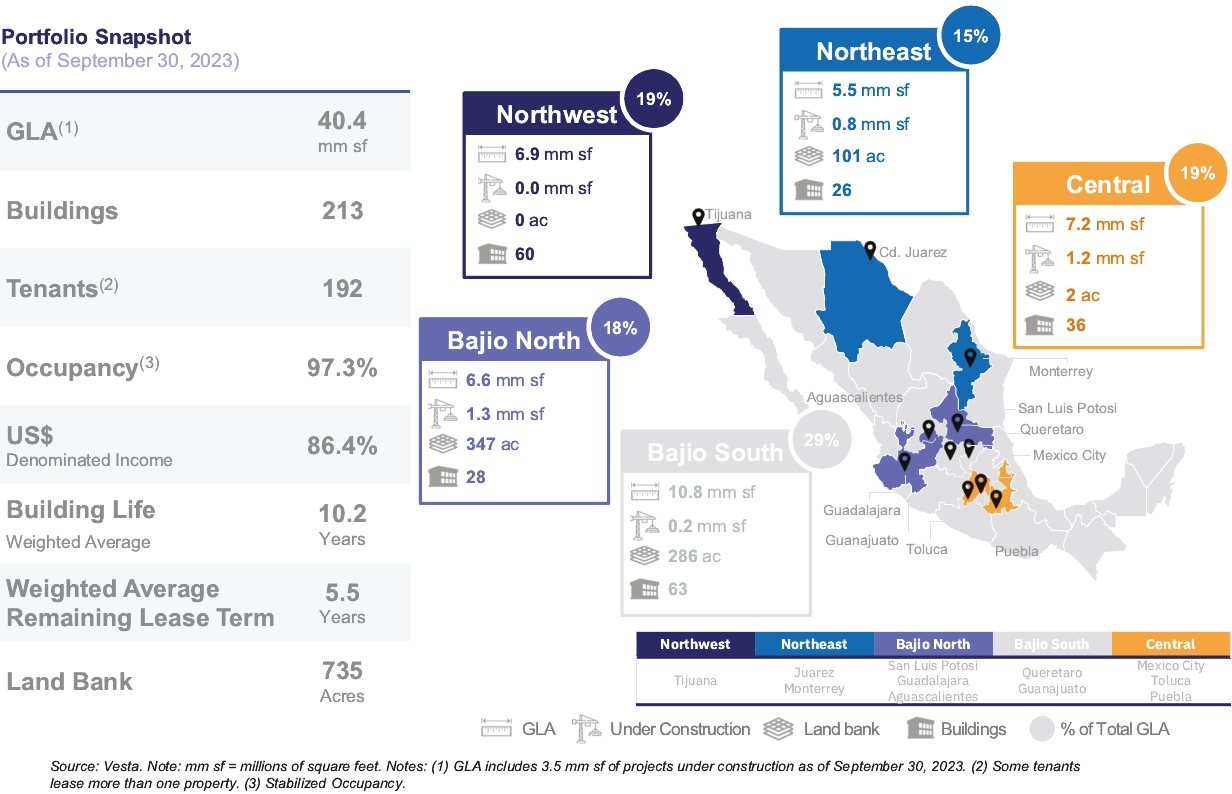
Number of real estate properties | | | 213 | | | 202 | | | 189 |
GLA (sq. feet)(1) | | | 36,905,960 | | | 33,714,370 | | | 31,081,746 |
Leased area (sq. feet)(2) | | | 34,128,931 | | | 32,054,026 | | | 29,257,404 |
Number of tenants | | | 192 | | | 183 | | | 175 |
Average rent per square foot (US$ per year)(3) | | | 5.4 | | | 5.0 | | | 4.5 |
Weighted average remaining lease term (years) | | | 5.5 | | | 4.9 | | | 4.3 |
Collected rental revenues per square foot (US$ per year)(4) | | | 5.4 | | | 4.7 | | | 4.7 |
Stabilized Occupancy rate (% of GLA)(5) | | | 97.3 | | | 97.3 | | | 94.3 |
(1) | Refers to the total GLA across all of our real estate properties. |
(2) | Refers to the GLA that was actually leased to tenants as of the dates indicated. |
(3) | Calculated as the annual base rent as of the end of the relevant period divided by the GLA. For rents denominated in pesos, annual rent is converted to US$ at the average exchange rate for each quarter. |
(4) | Calculated as the annual income collected from rental revenues during the relevant period divided by the square feet leased. For income collected denominated in pesos, income collected is converted to US$ at the average exchange rate for each quarter. |
(5) | We calculate stabilized occupancy rate as leased area divided by total GLA. We deem a property to be stabilized once it has reached 80.0% occupancy or has been completed for more than one year, whichever occurs first. |
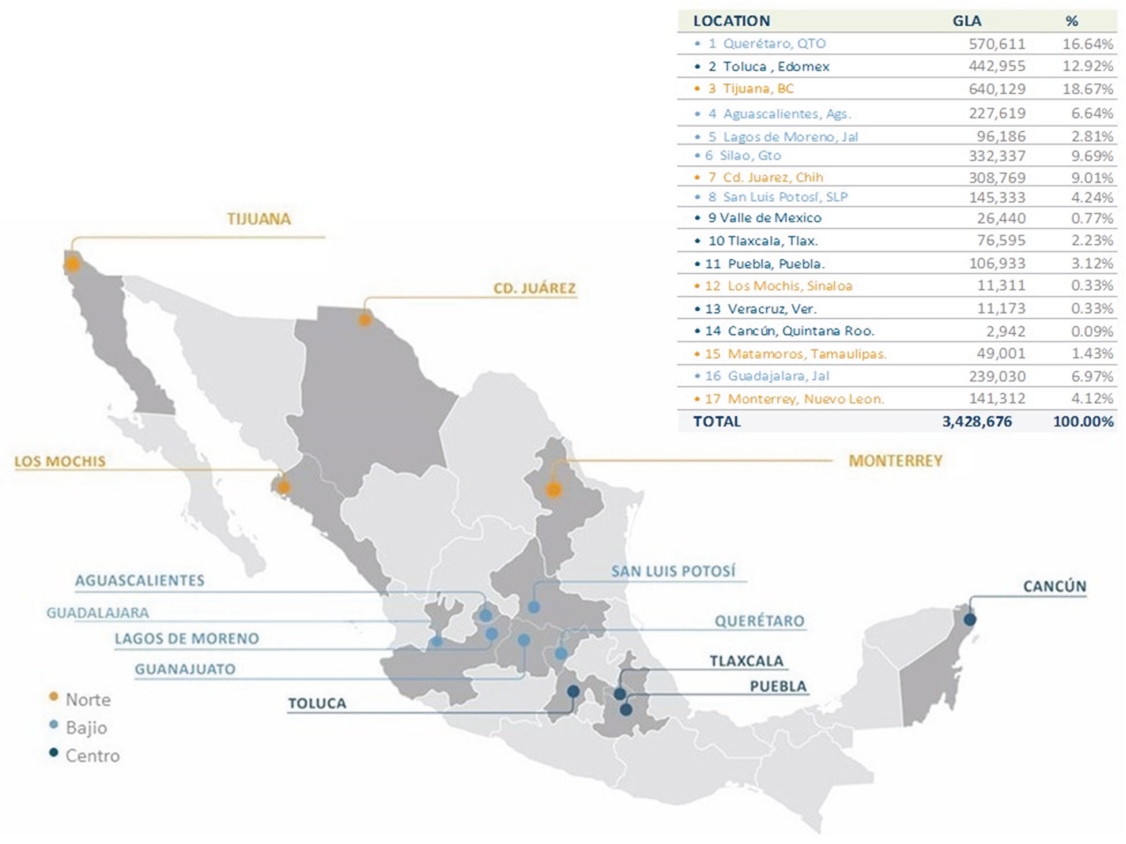
| | Location | | | Total GLA | | | Total GLA | | | Percentage of Portfolio GLA | | | Rental Income for the Three Months Ended September 30, 2023 | | | Percentage of Rental Income for the Three Months Ended September 30, 2023 | | | Operations Start Year | | | Number of Buildings | | | Appraisal Value as of September 30, 2023 | |
| | | | (in square feet) | | | (in square meters) | | | (%) | | | (US$) | | | (%) | | | | | | | (US$) | ||||
Industrial Park | | | | | | | | | | | | | | | | | | | |||||||||
DSP | | | Aguascalientes | | | 2,143,262 | | | 199,116 | | | 5.8 | | | 3,183,011 | | | 5.6 | | | 2013 | | | 8 | | | 137,700,000 |
Vesta Park Aguascalientes | | | Aguascalientes | | | 306,804 | | | 28,503 | | | 0.8 | | | 383,526 | | | 0.7 | | | 2019 | | | 2 | | | 18,500,000 |
Los Bravos Vesta Park | | | Cd Juárez | | | 460,477 | | | 42,780 | | | 1.2 | | | 685,568 | | | 1.2 | | | 2007 | | | 4 | | | 30,390,000 |
Vesta Park Juárez Sur I | | | Cd Juárez | | | 1,514,249 | | | 140,678 | | | 4.1 | | | 2,403,832 | | | 4.3 | | | 2015 | | | 8 | | | 113,030,000 |
Vesta Park Guadalajara | | | Guadalajara | | | 2,572,897 | | | 239,030 | | | 7.0 | | | 3,906,632 | | | 6.9 | | | 2020 | | | 6 | | | 230,650,000 |
Vesta Park Guadalupe | | | Monterrey | | | 497,929 | | | 46,259 | | | 1.3 | | | 1,350,665 | | | 2.4 | | | 2021 | | | 2 | | | 32,560,000 |
Vesta Puebla I | | | Puebla | | | 1,028,801 | | | 95,579 | | | 2.8 | | | 1,783,006 | | | 3.2 | | | 2016 | | | 5 | | | 86,150,000 |
Bernardo Quintana | | | Querétaro | | | 772,025 | | | 71,723 | | | 2.1 | | | 611,242 | | | 1.1 | | | 1998 | | | 9 | | | 39,840,000 |
PIQ | | | Querétaro | | | 2,109,491 | | | 195,978 | | | 5.7 | | | 2,982,995 | | | 5.3 | | | 2006 | | | 13 | | | 138,750,000 |
VP Querétaro | | | Querétaro | | | 923,238 | | | 85,772 | | | 2.5 | | | 742,069 | | | 1.3 | | | 2018 | | | 4 | | | 53,000,000 |
Querétaro Aerospace Park | | | Querétaro Aero | | | 2,337,248 | | | 217,137 | | | 6.3 | | | 3,800,159 | | | 6.7 | | | 2007 | | | 13 | | | 164,550,000 |
SMA | | | San Miguel de Allende | | | 1,361,708 | | | 126,507 | | | 3.7 | | | 1,529,865 | | | 2.7 | | | 2015 | | | 7 | | | 88,700,000 |
Las Colinas | | | Silao | | | 903,487 | | | 83,937 | | | 2.4 | | | 1,210,926 | | | 2.1 | | | 2008 | | | 7 | | | 57,750,000 |
Vesta Park Puento Interior | | | Silao | | | 1,312,047 | | | 121,893 | | | 3.6 | | | 1,661,113 | | | 2.9 | | | 2018 | | | 7 | | | 79,800,000 |
Tres Naciones | | | San Luis Potosí | | | 960,964 | | | 89,276 | | | 2.6 | | | 1,383,548 | | | 2.5 | | | 1999 | | | 9 | | | 63,550,000 |
Vesta Park SLP | | | San Luis Potosí | | | 603,385 | | | 56,056 | | | 1.6 | | | 615,708 | | | 1.1 | | | 2018 | | | 3 | | | 38,450,000 |
La Mesa Vesta Park | | | Tijuana | | | 810,013 | | | 75,253 | | | 2.2 | | | 1,178,598 | | | 2.1 | | | 2005 | | | 16 | | | 63,180,000 |
Nordika | | | Tijuana | | | 155,818 | | | 14,476 | | | 0.4 | | | 634,229 | | | 1.1 | | | 2007 | | | 1 | | | 17,150,000 |
El potrero | | | Tijuana | | | 282,771 | | | 26,270 | | | 0.8 | | | 381,977 | | | 0.7 | | | 2012 | | | 2 | | | 29,800,000 |
Vesta Park Tijuana III | | | Tijuana | | | 620,547 | | | 57,651 | | | 1.7 | | | 1,080,060 | | | 1.9 | | | 2014 | | | 3 | | | 55,640,000 |
Vesta Park Pacifico | | | Tijuana | | | 379,882 | | | 35,292 | | | 1.0 | | | 897,027 | | | 1.6 | | | 2017 | | | 2 | | | 30,700,000 |
VP Lago Este | | | Tijuana | | | 552,452 | | | 51,324 | | | 1.5 | | | 1,182,647 | | | 2.1 | | | 2018 | | | 2 | | | 71,100,000 |
Vesta Park Megaregion | | | Tijuana | | | 1,512,001 | | | 140,469 | | | 4.1 | | | 604,826 | | | 1.1 | | | 2022 | | | 7 | | | 150,070,000 |
VPT I | | | Tlaxcala | | | 680,616 | | | 63,231 | | | 1.8 | | | 1,030,341 | | | 1.8 | | | 2015 | | | 4 | | | 43,400,000 |
Exportec | | | Toluca | | | 220,122 | | | 20,450 | | | 0.6 | | | 278,679 | | | 0.5 | | | 1998 | | | 3 | | | 14,950,000 |
T 2000 | | | Toluca | | | 1,070,180 | | | 99,423 | | | 2.9 | | | 1,585,184 | | | 2.8 | | | 1998 | | | 3 | | | 83,810,000 |
El Coecillo Vesta Park | | | Toluca | | | 816,056 | | | 75,814 | | | 2.2 | | | 1,326,063 | | | 2.4 | | | 2007 | | | 1 | | | 57,130,000 |
Vesta Park Toluca I | | | Toluca | | | 1,000,161 | | | 92,918 | | | 2.7 | | | 1,553,202 | | | 2.8 | | | 2006 | | | 5 | | | 76,420,000 |
Vesta Park Toluca II | | | Toluca | | | 1,474,297 | | | 136,967 | | | 4.0 | | | 2,036,412 | | | 3.6 | | | 2014 | | | 6 | | | 111,800,000 |
Vesta Park Apodaca | | | Monterrey | | | 1,023,145 | | | 95,053 | | | 2.8 | | | — | | | 0.0 | | | 2023 | | | 4 | | | 76,270,000 |
Vesta Park Juarez Oriente | | | Cd Juarez | | | 529,389 | | | 49,182 | | | 1.4 | | | — | | | 0.0 | | | 2023 | | | 2 | | | 41,000,000 |
Other | | | | | 5,970,498 | | | 554,679 | | | 16.2 | | | 9,609,961 | | | 17.0 | | | na | | | 45 | | | 504,980,000 | |
| | Total | | | 36,905,960 | | | 3,428,676 | | | 100.0 | | | 51,613,071 | | | 91.5 | | | | | 213 | | | 2,800,770,000 | ||
| | Other income (reimbursements)(2) | | | 4,786,959 | | | 8.5 | | | | | | | |||||||||||||
| | Total | | | 56,400,030 | | | 100.0 | | | Vesta Offices at the DSP Park(3) | | | 300,000 | |||||||||||||
| | | | | | | | | | | | | | Under construction | | | 300,620,000 | ||||||||||
| | | | | | | | | | | | | | Total | | | 3,101,690,000 | ||||||||||
| | | | | | | | | | | | | | Land improvements | | | 13,794,975 | ||||||||||
| | | | | | | | | | | | | | Land Reserves | | | 140,100,000 | ||||||||||
| | | | | | | | | | | | | | Costs to Complete Construction in Process | | | -142,781,071 | ||||||||||
| | | | | | | | | | | | | | Appraisal Total | | | 3,112,803,904 |
(1) | Other income (reimbursements) includes: (i) the reimbursement of payments made by us on behalf of some of our tenants to cover maintenance fees and other services, which we incur under the respective lease contracts; and (ii) management fees arising from the real estate portfolio we sold in May 2019. |
(2) | Refers to the appraisal value of our corporate offices located at the Douki Seisan Park. |
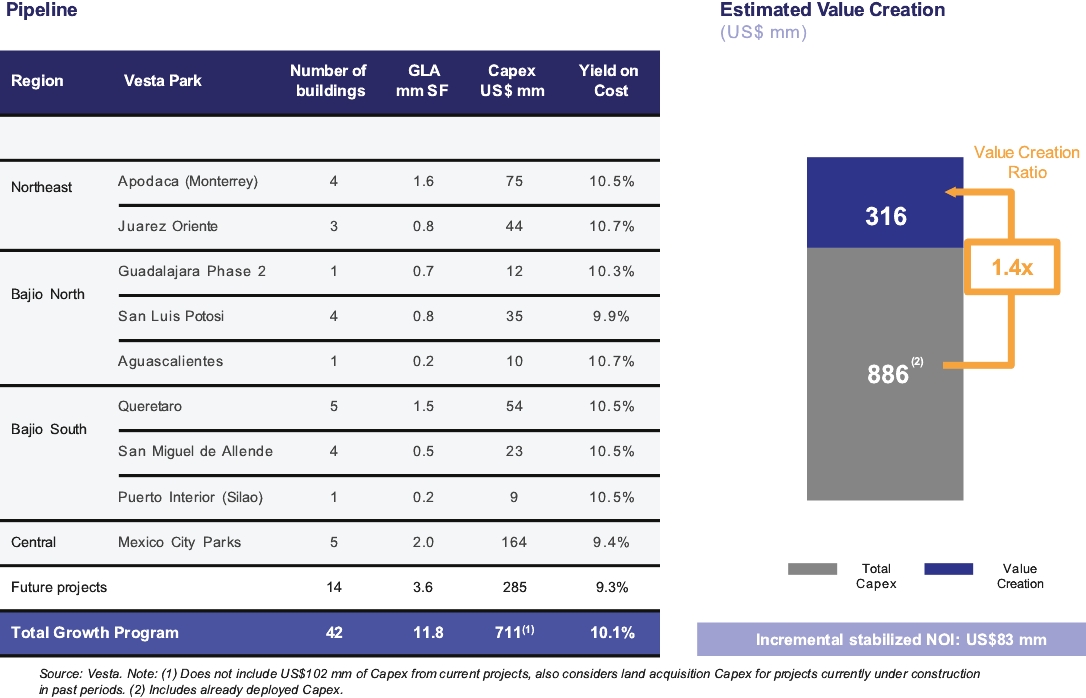
| | Project | | | Project GLA | | | Total Expected Investment (Thousand US$)(1) | | | Investment to Date (Thousand US$) | | | Leased | | | Expected Completion Date | | | Type | |||||||||||||
| Land + Infrastructure | | | Shell(2) | | | Total | | | Land + Infrastructure | | | Shell(2) | | | Total | | ||||||||||||||||
| | | | (in square feet) | | | (US$) | | | (US$) | | | (US$) | | | (US$) | | | (US$) | | | (US$) | | | (%) | | | | | ||||
North Region | | | | | | | | | | | | | | | | | | | | | | | |||||||||||
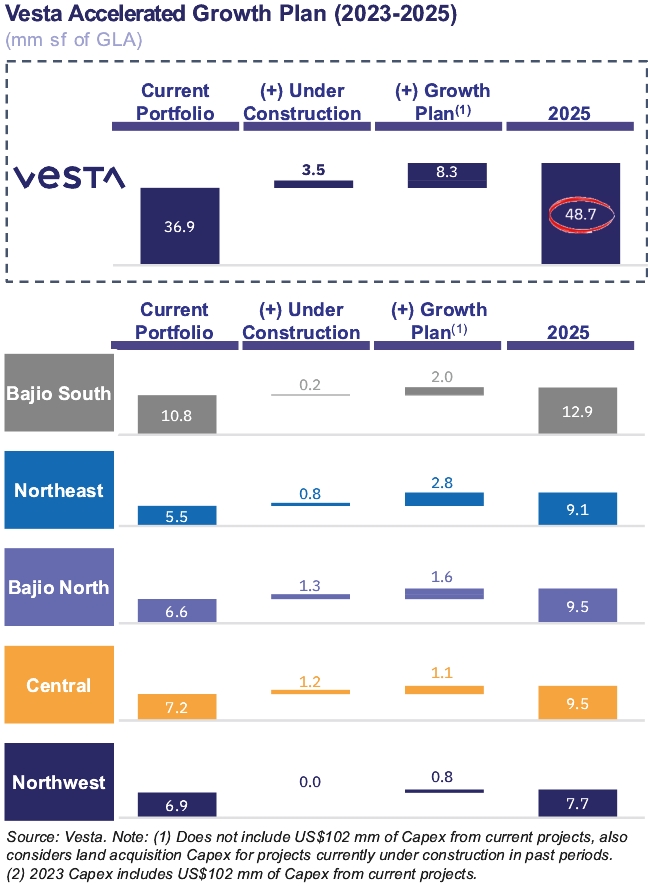
Ciudad Juárez | | | Juárez Oriente 3 | | | 283,338 | | | 7,121 | | | 14,050 | | | 21,171 | | | 240,837 | | | 2,136 | | | 242,973 | | | 0.0 | | | July 2024 | | | Inventory |
Ciudad Juárez | | | Juárez Oriente 4 | | | 297,741 | | | 7,482 | | | 14,801 | | | 22,283 | | | 253,080 | | | 2,245 | | | 255,325 | | | 0.0 | | | July 2024 | | | Inventory |
Ciudad Juárez | | | Juárez Oriente 5 | | | 210,800 | | | 5,298 | | | 11,353 | | | 16,651 | | | 179,180 | | | 2,119 | | | 181,299 | | | 100.0 | | | June 2024 | | | BTS |
| | | | 791,879 | | | 19,901 | | | 40,204 | | | 60,105 | | | 673,097 | | | 6,500 | | | 679,597 | | | 26.6 | | | | | ||||
Bajío Region | | | | | | | | | | | | | | | | | | | | | | | |||||||||||
Guadalajara | | | GDL 08 | | | 680,333 | | | 15,386 | | | 27,911 | | | 43,297 | | | 340,166 | | | 14,310 | | | 354,476 | | | 0.0 | | | October 2023 | | | Inventory |
Aguascalientes | | | Aguascalientes 3 | | | 200,318 | | | 1,746 | | | 10,365 | | | 12,111 | | | 180,286 | | | 524 | | | 180,810 | | | 31.0 | | | July 2024 | | | Inventory |
SLP | | | San Luis Potosí 4 | | | 262,532 | | | 2,588 | | | 13,210 | | | 15,798 | | | 236,279 | | | 776 | | | 237,055 | | | 0.0 | | | July 2024 | | | Inventory |
SLP | | | Tres Naciones 10 | | | 131,571 | | | 1,140 | | | 7,183 | | | 8,323 | | | 131,571 | | | 342 | | | 131,913 | | | 0.0 | | | May 2024 | | | Inventory |
Querétaro | | | Querétaro 6 | | | 214,760 | | | 2,434 | | | 9,892 | | | 12,326 | | | 214,760 | | | 1,122 | | | 215,882 | | | 100.0 | | | January 2024 | | | BTS |
| | | | 1,489,514 | | | 23,294 | | | 68,561 | | | 91,855 | | | 1,103,062 | | | 17,074 | | | 1,120,136 | | | 18.6 | | | | | ||||
Central Region | | | | | | | | | | | | | | | | | | | | | | | |||||||||||
Valle de México | | | La Villa | | | 213,065 | | | 22,086 | | | 10,012 | | | 32,098 | | | 181,105 | | | 6,626 | | | 187,731 | | | 0.0 | | | May 2024 | | | Inventory |
Valle de México | | | Punta Norte 1 | | | 845,957 | | | 50,582 | | | 37,905 | | | 88,487 | | | 575,250 | | | 15,175 | | | 590,425 | | | 0.0 | | | December 2024 | | | Inventory |
Valle de México | | | Punta Norte 2 | | | 171,286 | | | 10,241 | | | 8,408 | | | 18,649 | | | 116,475 | | | 3,072 | | | 119,547 | | | 0.0 | | | October 2024 | | | Inventory |
| | | | 1,230,308 | | | 82,909 | | | 56,325 | | | 139,234 | | | 872,830 | | | 24,873 | | | 897,703 | | | 0.0 | | | | | ||||
| | | | 3,511,701 | | | 126,104 | | | 165,090 | | | 291,194 | | | 2,648,989 | | | 48,447 | | | 2,697,436 | | | 13.9 | | | | |
(1) | Total Expected Investment comprises our material cash requirements, including commitments for capital expenditures. |
(2) | A shell is typically comprised by the primary structure, the building envelope (roof and façade), mechanical and supply systems (electricity, water and drainage) up to a single point of contact. |
Location | | | Total Land Reserves | | | Total Land Reserves | | | Percentage of Total Land Reserves | | | Appraisal Value as of September 30, 2023(1) | | | Estimated GLA to be Developed | | | Estimated GLA to be Developed |
| | (Hectares) | | | (Acres) | | | (%) | | | (thousands of US$) | | | (square meters) | | | (square feet) | |
Aguascalientes | | | 116.5 | | | 288.0 | | | 39.2 | | | 31,500 | | | 524,407 | | | 5,644,668 |
Querétaro | | | 48.0 | | | 118.5 | | | 16.1 | | | 31,880 | | | 215,874 | | | 2,323,652 |
Monterrey | | | 40.8 | | | 100.8 | | | 13.7 | | | 32,660 | | | 183,626 | | | 1,976,528 |
San Miguel Allende | | | 36.0 | | | 88.8 | | | 12.1 | | | 15,530 | | | 161,800 | | | 1,741,605 |
San Luis Potosí | | | 23.7 | | | 58.7 | | | 8.0 | | | 10,020 | | | 106,844 | | | 1,150,061 |
Guanajuato | | | 31.6 | | | 78.2 | | | 10.6 | | | 17,720 | | | 142,350 | | | 1,532,241 |
México | | | 0 | | | 0 | | | 0 | | | 0 | | | 0 | | | 0 |
Ciudad Juárez | | | 0 | | | 0 | | | 0 | | | 0 | | | 0 | | | 0 |
Guadalajara | | | 0 | | | 0 | | | 0 | | | 0 | | | 0 | | | 0 |
Tijuana | | | 0 | | | 0 | | | 0 | | | 0 | | | 0 | | | 0 |
Puebla | | | 0.9 | | | 2.1 | | | 0.3 | | | 790 | | | 3,869 | | | 41,647 |
Total | | | 297.5 | | | 735.1 | | | 100.0 | | | 140,100 | | | 1,338,770 | | | 14,410,402 |
(1) | Land value is appraised at cost. For more information, see “Presentation of Financial and Certain Other Information—Appraisals.” |
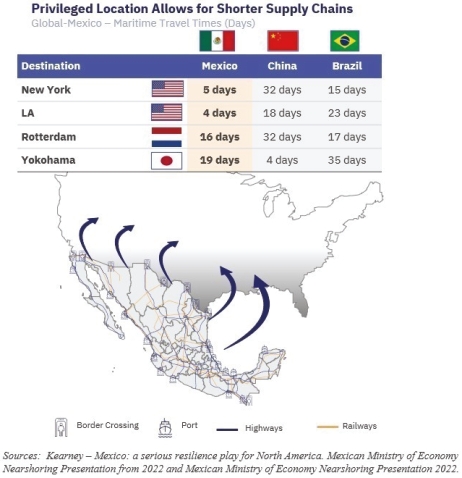
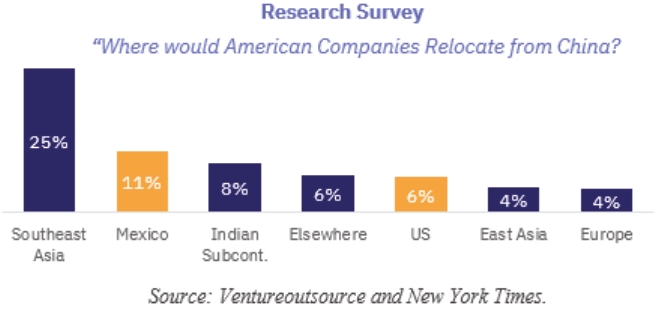
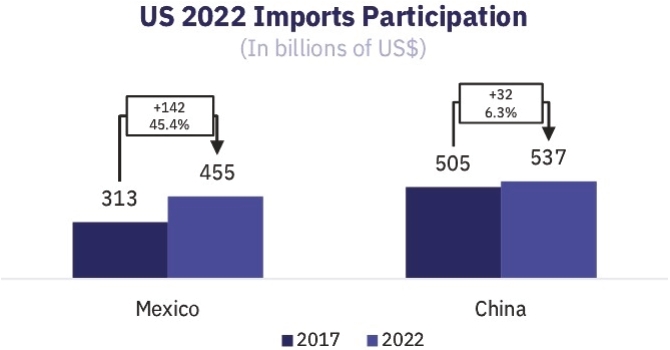
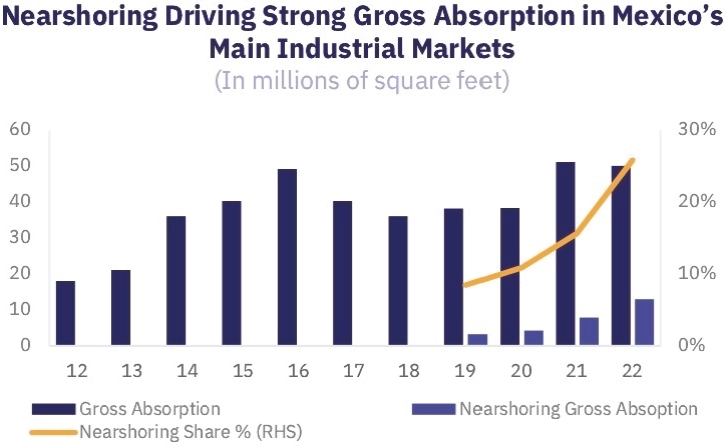
• | geopolitical tensions between the U.S. and China leading to relocation of Asia-based operations to North America; |
• | pandemic-disrupted supply chains, including shortages of raw materials and manufacturing components; |
• | a challenging labor and logistics environment in the U.S.; and |
• | the Russia-Ukraine conflict. |
• | Governance and integrity: (i) 100.0% of investment decisions under responsible investment guidelines, including the United Nations Principles for Responsible Investments (“UN PRI”), (ii) establish ESG commitments with 35% of our total supply chain, and (iii) additional women as permanent members of our Board of Directors, consistent with global trends; |
• | Social: (i) achieve strategic alliances for our ESG projects (for example, with local communities and other private organizations), consisting of increasing the total impact of the initiatives, both in terms of people and size of projects, (ii) firm-wide continuous training in ESG practices, and (iii) reduce salary gender gap, primarily at the management level; and |
• | Environment: (i) reduce carbon footprint and water consumption in areas of real estate development managed or to be managed by Vesta, (ii) increase waste recycled by Vesta, (iii) identify all physical and transitional risks of our portfolio and operations to determine mitigation and prevention actions, and (iv) increase the percentage of our GLA to have green certifications, such as LEED, BOMA and EDGE. |
• | The success of our business depends on general economic conditions and prevailing conditions in the real estate industry. Accordingly, any economic slowdown or downturn in real estate asset values or leasing activity may have a material adverse effect on our business, financial condition, results of operations and prospects and/or the liquidity or trading price of our ADSs. |
• | The volatility of the financial markets may adversely affect our financial condition and/or results of operations. |
• | Real estate investments are not as liquid as certain other types of assets, which may adversely affect our financial conditions and results of operations. |
• | Investments in real estate properties are subject to risks that could adversely affect our business. |
• | We are dependent on our tenants for a substantial portion of our revenues and our business would be materially and adversely affected if a significant number of our tenants, or any of our major tenants, were to default on their obligations under their leases. |
• | We derive a significant portion of our rental income from a limited number of customers. |
• | Our clients operate in certain specific industrial sectors in Mexico, and our business may be adversely affected by an economic downturn in any of those sectors. |
• | An increase in competition could lead to lower occupancy rates and rental income and could result in fewer investment opportunities. |
• | We may not be successful in executing on our accelerated growth strategy if we are unable to make acquisitions of land or properties. |
• | We are dependent on our ability to raise capital through financial markets, divestitures or other sources to meet our future growth expectations. |
• | We are subject to risks related to the development of new properties, including due to an increase in construction costs and supply chain issues. |
• | Our business and operations could suffer in the event of system failures or cyber security attacks. |
• | Adverse economic conditions in Mexico may have a negative impact on our financial condition and/or results of operations. |
• | Political and social developments in Mexico as well as changes in Federal Governmental policies could have a negative impact on our business and results of operations. |
• | Legislative or regulatory action with respect to tax laws and regulations could adversely affect us. |
• | Developments in the U.S. and other countries may adversely affect Mexico’s economy, our business, financial condition and/or results of operations, and the market price of our ADSs. |
• | Mexico is an emerging market economy, with risks to our results of operations and financial condition. |
• | Changes in exchange rates between the peso and the U.S. dollar or other currencies may adversely affect our financial condition and/or results of operations. |
• | The price of our ADSs or common shares may be volatile or may decline regardless of our operating performance, and you may not be able to resell your ADSs or common shares at or above the offering price. |
• | Our bylaws contain restrictions on certain transfers of common shares and the execution of shareholders agreements, which could impede the ability of holders of ADSs to benefit from a change in control or to change our management and Board of Directors. |
• | You may not be able to sell your ADSs at the time or the price you desire because an active or liquid market may not develop. |
• | The relative volatility and illiquidity of the Mexican securities markets may substantially limit your ability to sell the common shares underlying the ADSs at the price and time you desire. |
• | Sales of our ADSs or common shares by our founders, directors or officers, or the perception that these sales may occur may cause our share price to decline. |
• | We are subject to different disclosure and accounting standards than companies in other countries. |
• | If we issue or sell additional equity securities in the future, we may suffer dilution and the trading prices for our securities may decline. |
• | The payment and amount of dividends are subject to the determination of our shareholders. |
• | As a foreign private issuer and an “emerging growth company” (as defined in the JOBS Act), we have different disclosure and other requirements than U.S. registrants and non-emerging growth companies. |
• | We may lose our foreign private issuer status, which would then require us to comply with the Exchange Act’s domestic reporting regime and cause us to incur additional legal, accounting and other expenses. |
• | As a foreign private issuer, we rely on exemptions from certain NYSE corporate governance standards applicable to U.S. issuers, including the requirement that a majority of an issuer’s directors consist of independent directors. This may afford less protection to holders of our common shares. |
• | There can be no assurance that we will not be a passive foreign investment company, or PFIC, for any taxable year, which could result in adverse U.S. federal income tax consequences to U.S. investors in our common shares or our ADSs. |
| | For the Three-Month Period Ended September 30, | | | For the Nine-Month Period Ended September 30, | | | For the Year Ended December 31, | ||||||||||
| | 2023 | | | 2022 | | | 2023 | | | 2022 | | | 2022 | | | 2021 | |
| | (millions of US$, except per share data) | ||||||||||||||||
Revenue: | | | | | | | | | | | | | ||||||
Rental income | | | 55.8 | | | 45.5 | | | 157.6 | | | 130.6 | | | 178.0 | | | 160.7 |
Management fees | | | 0.6 | | | — | | | 0.9 | | | — | | | — | | | 0.1 |
| | | | | | | | | | | | |||||||
Property operating costs related to properties that generated rental income | | | (4.4) | | | (2.3) | | | (10.3) | | | (6.1) | | | (8.9) | | | (8.5) |
Property operating costs related to properties that did not generate rental income | | | (1.4) | | | (0.6) | | | (3.0) | | | (1.5) | | | (2.5) | | | (2.2) |
General and administrative expenses | | | (7.3) | | | (5.9) | | | (22.3) | | | (18.5) | | | (24.4) | | | (21.4) |
| | | | | | | | | | | | |||||||
Interest income | | | 4.4 | | | 1.4 | | | 5.5 | | | 1.5 | | | 2.6 | | | 0.1 |
Other income – net | | | 1.7 | | | 0.3 | | | 2.4 | | | 0.6 | | | 1.0 | | | — |
Finance costs | | | (11.4) | | | (11.8) | | | (34.7) | | | (34.1) | | | (46.4) | | | (50.3) |
Exchange gain (loss) – net | | | (2.2) | | | (0.9) | | | 6.2 | | | (0.3) | | | 1.9 | | | (1.1) |
Gain on sale of investment property | | | — | | | — | | | — | | | 5.0 | | | 5.0 | | | 14.0 |
Gain on revaluation of investment property | | | 95.2 | | | 63.0 | | | 179.5 | | | 139.8 | | | 185.5 | | | 164.6 |
Profit before income taxes | | | 131.0 | | | 88.7 | | | 281.8 | | | 217.0 | | | 291.8 | | | 256.0 |
Total income tax expense | | | (54.8) | | | (26.7) | | | (79.0) | | | (52.1) | | | (48.2) | | | (82.1) |
Profit for the period | | | 76.2 | | | 62.0 | | | 202.8 | | | 164.9 | | | 243.6 | | | 173.9 |
Other comprehensive income (loss) – net of tax: | | | | | | | | | | | | | ||||||
Items that may be reclassified subsequently to profit – Fair value gain on derivative instruments | | | — | | | — | | | — | | | — | | | — | | | 2.9 |
Exchange differences on translating other functional currency operations | | | 2.8 | | | 0.3 | | | 9.4 | | | 3.0 | | | 8.9 | | | (4.8) |
Total other comprehensive income | | | 2.8 | | | 0.3 | | | 9.4 | | | 3.0 | | | 8.9 | | | (2.0) |
Total comprehensive income for the period | | | 79.0 | | | 62.3 | | | 212.2 | | | 168.0 | | | 252.5 | | | 172.0 |
Basic earnings per share | | | 0.0928 | | | 0.0912 | | | 0.2777 | | | 0.2413 | | | 0.3569 | | | 0.2683 |
Diluted earnings per share | | | 0.0914 | | | 0.0896 | | | 0.2734 | | | 0.2373 | | | 0.3509 | | | 0.2636 |
| | As of September 30, | | | As of December 31, | ||||
| | 2023 | | | 2022 | | | 2021 | |
| | (millions of US$) | |||||||
Assets | | | | | | | |||
Current assets: | | | | | | | |||
Cash, cash equivalents and restricted cash | | | 408.2 | | | 139.1 | | | 452.8 |
Recoverable taxes | | | 31.3 | | | 30.1 | | | 19.4 |
Operating lease receivables | | | 8.9 | | | 7.7 | | | 9.0 |
Prepaid expenses and advance payments | | | 21.4 | | | 25.3 | | | 0.5 |
Total current assets | | | 469.8 | | | 202.2 | | | 481.7 |
Non-current assets: | | | | | | | |||
Investment property | | | 3,112.8 | | | 2,738.5 | | | 2,263.2 |
Office furniture – Net | | | 1.1 | | | 1.4 | | | 2.1 |
Right-of-use asset | | | 0.9 | | | 1.4 | | | 1.3 |
Guarantee deposits made, restricted cash and others | | | 9.8 | | | 9.6 | | | 11.5 |
Total non-current assets | | | 3,124.6 | | | 2,750.9 | | | 2,278.2 |
Total assets | | | 3,594.4 | | | 2,953.1 | | | 2,759.9 |
| | | | | | ||||
Liabilities and stockholders’ equity | | | | | | | |||
Current liabilities: | | | | | | | |||
Current portion of long-term debt | | | 4.8 | | | 4.6 | | | 2.9 |
Leases payable – short term | | | 0.6 | | | 0.6 | | | 0.5 |
Accrued interest | | | 7.5 | | | 3.8 | | | 3.8 |
Accounts payable | | | 17.0 | | | 16.6 | | | 3.0 |
Income tax payable | | | 42.4 | | | 14.8 | | | 27.8 |
Accrued expenses and taxes | | | 5.7 | | | 5.2 | | | 15.3 |
Dividends payable | | | 30.3 | | | 14.4 | | | 13.9 |
Total current liabilities | | | 108.3 | | | 60.0 | | | 67.2 |
Non-current liabilities: | | | | | | | |||
Long-term debt | | | 923.4 | | | 925.9 | | | 930.7 |
Leases payable – long term | | | 0.4 | | | 0.9 | | | 0.9 |
Guarantee deposits received | | | 22.7 | | | 18.3 | | | 15.9 |
Long-term account payable | | | 7.7 | | | 7.9 | | | — |
Employee benefits | | | 1.3 | | | 0.3 | | | — |
Deferred income tax | | | 309.9 | | | 300.0 | | | 291.6 |
Total non-current liabilities | | | 1,265.4 | | | 1,253.3 | | | 1,239.0 |
Total liabilities | | | 1,373.7 | | | 1,313.3 | | | 1,306.2 |
Stockholders’ equity: | | | | | | | |||
Capital stock | | | 567.1 | | | 480.6 | | | 482.9 |
Additional paid-in capital | | | 807.1 | | | 460.7 | | | 466.2 |
Retained earnings | | | 875.9 | | | 733.4 | | | 547.2 |
Share-based payments reserve | | | 2.0 | | | 6.0 | | | 7.1 |
Foreign currency translation | | | (31.4) | | | (40.9) | | | (49.8) |
Total stockholders’ equity | | | 2,220.7 | | | 1,639.8 | | | 1,453.6 |
Total liabilities and stockholders’ equity | | | 3,594.4 | | | 2,953.1 | | | 2,759.9 |
| | For the Three-Month Period Ended September 30, | | | For the Nine-Month Period Ended September 30, | | | For the Year Ended December 31, | ||||||||||
| | 2023 | | | 2022 | | | 2023 | | | 2022 | | | 2022 | | | 2021 | |
| | (millions of US$) | ||||||||||||||||
Profit for the period | | | 76.2 | | | 62.0 | | | 202.8 | | | 164.9 | | | 243.6 | | | 173.9 |
(+) Total income tax expense | | | 54.8 | | | 26.7 | | | 79.0 | | | 52.1 | | | 48.2 | | | 82.1 |
(-) Interest income | | | 4.4 | | | 1.4 | | | 5.5 | | | 1.5 | | | 2.6 | | | 0.1 |
(-) Other income – net(1) | | | 1.7 | | | 0.3 | | | 2.4 | | | 0.6 | | | 1.0 | | | — |
(+) Finance costs | | | 11.4 | | | 11.8 | | | 34.7 | | | 34.1 | | | 46.4 | | | 50.3 |
(-) Exchange gain (loss) – net | | | (2.2) | | | (0.9) | | | 6.2 | | | (0.3) | | | 1.9 | | | 1.1 |
(-) Gain on sale of investment property | | | — | | | — | | | — | | | 5.0 | | | 5.0 | | | 14.0 |
| | For the Three-Month Period Ended September 30, | | | For the Nine-Month Period Ended September 30, | | | For the Year Ended December 31, | ||||||||||
| | 2023 | | | 2022 | | | 2023 | | | 2022 | | | 2022 | | | 2021 | |
| | (millions of US$) | ||||||||||||||||
(-) Gain on revaluation of investment property | | | 95.2 | | | 63.0 | | | 179.5 | | | 139.8 | | | 185.5 | | | 164.6 |
(+) Depreciation | | | 0.2 | | | 0.3 | | | 1.0 | | | 1.1 | | | 1.5 | | | 1.6 |
(+) Long-term incentive plan and Equity plus | | | 1.8 | | | 1.6 | | | 6.3 | | | 5.0 | | | 6.7 | | | 5.6 |
Adjusted EBITDA | | | 45.3 | | | 38.6 | | | 130.2 | | | 110.6 | | | 150.4 | | | 133.6 |
(+) General and administrative expenses | | | 7.3 | | | 5.9 | | | 22.3 | | | 18.5 | | | 24.4 | | | 21.4 |
(-) Long-term incentive plan and Equity plus | | | 1.8 | | | 1.6 | | | 6.3 | | | 5.0 | | | 6.7 | | | 5.6 |
NOI | | | 50.8 | | | 42.9 | | | 146.2 | | | 124.1 | | | 168.1 | | | 149.4 |
(+) Property operating costs related to properties that did not generate rental income | | | 1.4 | | | 0.6 | | | 3.0 | | | 1.5 | | | 2.5 | | | 2.2 |
Adjusted NOI | | | 52.2 | | | 43.5 | | | 149.2 | | | 125.6 | | | 170.6 | | | 151.6 |
(1) | Includes other income and expenses unrelated to our operations, such as excess electricity sales and sales of office equipment. |
| | For the Three -Month Period Ended September 30, | |||||||||||||
| | 2023 | | | 2022 | | | 2023 (per share) | | | 2022 (per share) | | |||
| | (millions of US$) | | | | | | ||||||||
Profit for the period | | | 76.2 | | | 62.0 | | | 0.0928 | | | 0.0912 | | ||
(-) Gain on sale of investment property | | | — | | | — | | | 0.0000 | | | 0.0000 | | ||
(-) Gain on revaluation of investment property | | | 95.2 | | | 63.0 | | | 0.1159 | | | 0.0927 | | ||
FFO | | | (19.0) | | | (1.0) | | | (0.0231) | | | (0.0015) | | ||
(-) Exchange gain (loss) – net | | | (2.2) | | | (0.9) | | | (0.0027) | | | (0.0013) | |
| | For the Three -Month Period Ended September 30, | |||||||||||||
| | 2023 | | | 2022 | | | 2023 (per share) | | | 2022 (per share) | | |||
| | (millions of US$) | | | | | | ||||||||
(-) Other income – net(1) | | | 1.7 | | | 0.3 | | | 0.0021 | | | 0.0004 | | ||
(-) Interest income | | | 4.4 | | | 1.4 | | | 0.0054 | | | 0.0021 | | ||
(+) Total income tax expense | | | 54.8 | | | 26.7 | | | 0.0667 | | | 0.0393 | | ||
(+) Depreciation | | | 0.2 | | | 0.3 | | | 0.0002 | | | 0.0004 | | ||
(+) Long-term incentive plan and Equity plus | | | 1.8 | | | 1.6 | | | 0.0022 | | | 0.0024 | | ||
Vesta FFO | | | 33.9 | | | 26.8 | | | 0.0413 | | | 0.0394 | |
| | For the Nine -Month Period Ended September 30, | ||||||||||
| | 2023 | | | 2022 | | | 2023 (per share) | | | 2022 (per share) | |
| | (millions of US$) | | | | | ||||||
Profit for the period | | | 202.8 | | | 164.9 | | | 0.2777 | | | 0.2412 |
(-) Gain on sale of investment property | | | — | | | 5.0 | | | 0.0000 | | | 0.0073 |
(-) Gain on revaluation of investment property | | | 179.5 | | | 139.8 | | | 0.2458 | | | 0.2045 |
FFO | | | 23.3 | | | 20.1 | | | 0.0319 | | | 0.0294 |
(-) Exchange gain (loss) – net | | | 6.2 | | | (0.3) | | | 0.0085 | | | (0.0004) |
(-) Other income – net(1) | | | 2.4 | | | 0.6 | | | 0.0033 | | | 0.0009 |
(-) Interest income | | | 5.5 | | | 1.5 | | | 0.0075 | | | 0.0022 |
(+) Total income tax expense | | | 79.0 | | | 52.1 | | | 0.1082 | | | 0.0762 |
(+) Depreciation | | | 1.0 | | | 1.1 | | | 0.0014 | | | 0.0016 |
(+) Long-term incentive plan and Equity plus | | | 6.3 | | | 5.0 | | | 0.0086 | | | 0.0073 |
Vesta FFO | | | 95.5 | | | 76.5 | | | 0.1308 | | | 0.1119 |
(1) | Includes other income and expenses unrelated to our operations, such as excess energy sales, other administration services and sales of office equipment. |
| | For the Year Ended December 31, | ||||||||||
| | 2022 | | | 2021 | | | 2022 (per share) | | | 2021 (per share) | |
| | (millions of US$) | | | | | ||||||
Profit for the period | | | 243.6 | | | 173.9 | | | 0.3568 | | | 0.2682 |
(-) Gain on sale of investment property | | | 5.0 | | | 14.0 | | | 0.0073 | | | 0.0216 |
(-) Gain on revaluation of investment property | | | 185.5 | | | 164.6 | | | 0.2717 | | | 0.2538 |
FFO | | | 53.1 | | | (4.7) | | | 0.0778 | | | (0.0072) |
(-) Exchange gain (loss) – net | | | 1.9 | | | (1.1) | | | 0.0028 | | | (0.0017) |
(-) Other income – net(1) | | | 1.0 | | | — | | | 0.0015 | | | 0.0000 |
(-) Interest income | | | 2.6 | | | 0.1 | | | 0.0038 | | | 0.0002 |
(+) Total income tax expense | | | 48.2 | | | 82.1 | | | 0.0706 | | | 0.1266 |
(+) Depreciation | | | 1.5 | | | 1.6 | | | 0.0022 | | | 0.0025 |
(+) Long-term incentive plan and Equity plus | | | 6.7 | | | 5.6 | | | 0.0098 | | | 0.0086 |
Vesta FFO | | | 104.0 | | | 85.6 | | | 0.1523 | | | 0.1320 |
(1) | Includes other income and expenses unrelated to our operations, such as excess electricity sales and sales of office equipment. For more information, see note 15 to our audited consolidated financial statements. |
| | As of September 30, | | | As of December 31, | ||||
| | 2023 | | | 2022 | | | 2021 | |
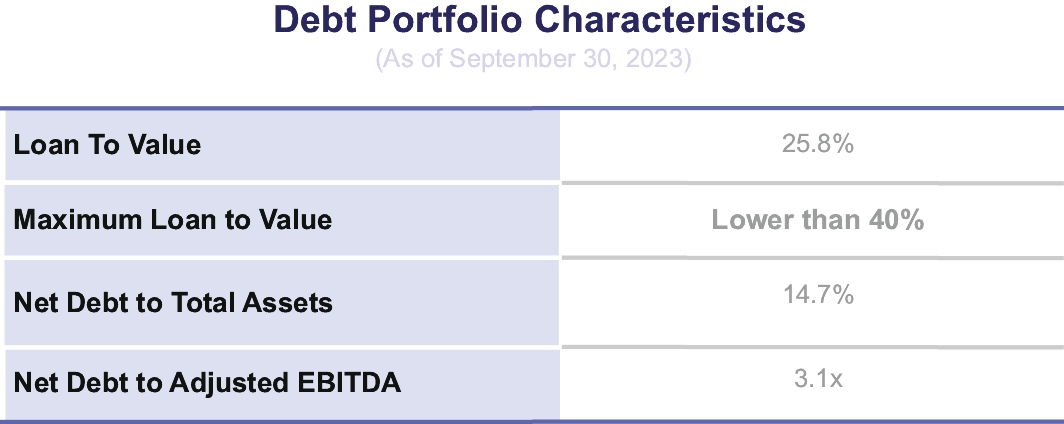
Net Debt to Total Assets(1) | | | 0.1x | | | 0.3x | | | 0.2x |
Net Debt to Adjusted EBITDA(2) | | | 3.1x(3) | | | 5.3x | | | 3.7x |
(1) | Net Debt to Total Assets represents (i) our gross debt (defined as current portion of long-term debt plus long-term debt plus amortization of debt issuance costs) less cash and cash equivalents divided by (ii) total assets. Our management believes that this ratio is useful because it shows the degree in which net debt has been used to finance our assets and using this measure investors and analysts can compare the leverage shown by this ratio with that of other companies in the same industry. |
(2) | Net Debt to Adjusted EBITDA represents (i) our gross debt (defined as current portion of long-term debt plus long-term debt plus amortization of debt issuance costs) less cash and cash equivalents divided by (ii) Adjusted EBITDA. Our management believes that this ratio is useful because it provides investors with information on our ability to repay debt, compared to our performance as measured using Adjusted EBITDA. |
(3) | Net Debt to Adjusted EBITDA as of September 30, 2023, is presented using Adjusted EBITDA as calculated based on a last twelve-months basis, which we calculate as Adjusted EBITDA for the nine-month period ended September 30, 2023, plus Adjusted EBITDA for the year ended December 31, 2022, less Adjusted EBITDA for the nine-month period ended September 30, 2022. |
| | As of September 30, | | | As of December 31, | ||||
| | 2023 | | | 2022 | | | 2021 | |
| | (in millions of US$) | |||||||
Total debt | | | 937.2 | | | 940.6 | | | 943.5 |
Current portion of long-term debt | | | 4.8 | | | 4.6 | | | 2.9 |
Long-term debt | | | 923.4 | | | 925.9 | | | 930.7 |
Direct issuance cost | | | 9.0 | | | 10.1 | | | 10.0 |
(-) Cash and cash equivalents | | | 408.2 | | | 139.1 | | | 452.8 |
Net debt | | | 529.0 | | | 801.5 | | | 490.8 |
| | As of September 30, | | | As of December 31, | ||||
| | 2023 | | | 2022 | | | 2021 | |
| | (number of properties) | |||||||
Total properties | | | 213 | | | 202 | | | 189 |
Same-Store Properties | | | 193 | | | 189 | | | 185 |
Non-Same-Store Properties | | | 20 | | | 13 | | | 4 |
| | For the Nine Months Ended September 30, | | | For the Year Ended December 31, | ||||
| | 2023 | | | 2022 | | | 2021 | |
| | (millions of US$) | |||||||
Profit for the period | | | 202.8 | | | 243.6 | | | 173.9 |
(+) Total income tax expense | | | 79.0 | | | 48.2 | | | 82.1 |
(-) Interest income | | | 5.5 | | | 2.6 | | | 0.1 |
(-) Other income – net(1) | | | 2.4 | | | 1.0 | | | — |
(+) Finance costs | | | 34.7 | | | 46.4 | | | 50.3 |
(-) Exchange gain (loss) – net | | | 6.2 | | | 1.9 | | | (1.1) |
(-) Gain on sale of investment property | | | — | | | 5.0 | | | 14.0 |
(-) Gain on revaluation of investment property | | | 179.5 | | | 185.5 | | | 164.6 |
(+) General and administrative expenses | | | 22.3 | | | 24.4 | | | 21.4 |
(+) Property operating costs related to properties that did not generate rental income | | | 3.0 | | | 2.5 | | | 2.2 |
(+) Property operating costs related to properties that did generate rental income related to non-Same-Store Properties | | | 2.7 | | | 0.1 | | | 0.6 |
(-) Management fees related to non Same-Store Properties | | | — | | | — | | | 0.1 |
(-) Rental income related to non Same-Store Properties | | | 10.7 | | | 12.4 | | | 7.7 |
Same-Store NOI | | | 140.2 | | | 156.8 | | | 145.1 |
(1) | Includes other income and expenses unrelated to our operations, such as excess electricity sales and sales of office equipment. |
| | As of September 30, | | | As of December 31, | ||||
| | 2023 | | | 2022 | | | 2021 | |
Total GLA (sq. feet) | | | 36,905,960 | | | 33,714,370 | | | 31,081,746 |
Total GLA (sq. meters) | | | 3,428,676 | | | 3,132,168 | | | 2,887,589 |
Stabilized occupancy rate(1) | | | 97.3% | | | 97.3% | | | 94.3% |
(1) | Stabilized occupancy rate refers to the rate of occupied stabilized properties only. We deem a property to be stabilized once it has reached 80.0% occupancy or has been completed for more than one year, whichever occurs first. |
• | a general decline in the price of rents or less favorable terms for new leases or renewals; |
• | the depreciation of the value of the properties in our portfolio; |
• | increased vacancy rates or our inability to lease our properties on favorable conditions; |
• | our inability to collect rents from our tenants; |
• | reduced levels of demand for industrial space and industrial facilities, or changes in consumer preferences vis-à-vis our available properties; |
• | an increased supply of industrial facilities or more suitable spaces in the markets in which we operate; |
• | higher interest rates, increased leasing costs, increased construction costs, distressed supply chains for construction materials, increased maintenance costs, reduced availability of financing on favorable terms and shortage of mortgage loans, lines of credit and other capital resources, all of which could increase our costs and limit our ability to acquire or develop additional real estate assets or refinance our debt; |
• | measures that limit our ability to develop acquired land pursuant to existing plans; |
• | increased costs and expenses, including, among other things, for insurance, labor, energy, real estate appraisals, real estate taxes and compliance with applicable laws and regulations; and |
• | the adoption of restrictive government policies or the imposition of limitations on our ability to pass on costs to our customers. |
• | local conditions, such as oversupply or a reduction in demand; |
• | technological changes, such as reconfiguration of supply chains, robotics, 3D printing or other technologies; |
• | the attractiveness and quality of our properties, and related services, to potential tenants and competition from other available properties; |
• | increasing costs of maintaining, insuring, renovating and making improvements to our properties; |
• | our ability to reposition our properties due to changes in the business and logistics needs of our customers; |
• | our ability to lease properties at favorable rates, including periodic increases based on inflation or exchange rates, and control variable operating costs; |
• | social problems, including safety, affecting certain regions; |
• | governmental and environmental regulations and the associated potential liability under, and changes in, environmental, community rights, zoning, usage, tax, tariffs and other laws; and |
• | reduction on the supply, price increases and other restrictions affecting the supply of key resources, such as water and electricity, may affect the construction industry and the operation of rental facilities in Mexico. |
• | we may not be able to acquire desired properties, including other real estate developers and real estate investment funds, particularly in markets in which we do not currently operate; |
• | we may need additional land bank to accelerate our portfolio growth and execute our growth strategy to meet our goals; |
• | we may not be able to obtain financing for the relevant acquisition given our existing leverage position and increased interest rates; |
• | the properties we acquire may not prove accretive to our results, or that we may not be able to successfully manage and lease those properties to meet our goals; |
• | we may not be able to generate sufficient operating cash flows to make an acquisition; |
• | we may need to spend additional amounts than budgeted to develop a property or make necessary improvements or renovations; |
• | competition from other potential acquirors may significantly increase the purchase price of a desired property; |
• | we may spend significant time and money on potential acquisitions that we are unable to make as a result of the lack of satisfaction of customary closing conditions included in the agreements for the acquisition of properties, including the satisfactory completion of due diligence investigations; |
• | we may not be able to obtain any or all regulatory approvals necessary to complete the acquisition, including from the Mexican Antitrust Commission (Comisión Federal de Competencia Economica or “COFECE”); |
• | the process of pursuing and consummating an acquisition may distract the attention of our senior management from our existing business operations; |
• | we may experience delays (temporary or permanent) if there is public or government opposition to our activities; and |
• | we may not be able to rapidly and efficiently integrate new acquisitions, especially acquisitions of real estate portfolios, to our existing operations. |
• | shortages of materials or skilled labor; |
• | a change in the scope of the original project; |
• | the difficulty in obtaining necessary zoning, land-use, environmental, health & safety, building, occupancy, antitrust and other governmental permits; |
• | economic or political conditions affecting the relevant location; |
• | an increase in the cost of building materials and equipment; |
• | the discovery of structural or other latent defects in the property once construction has commenced; and |
• | delays in securing tenants. |
• | the appetite of investors; |
• | our financial performance and that of our tenants; |
• | our ability to meet market expectations and the expectations of our investors with respect to our business; |
• | the reports of financial analysts with respect to our business; |
• | the prevailing economic, political and social environment in Mexico; |
• | the condition of the capital markets, including changes in the prevailing interest rates for fixed-income securities; |
• | the prevailing legal environment in Mexico with respect to the protection of minority shareholder interests; |
• | distributions to our shareholders, which largely depend on our operating cash flows, which in turn are dependent on the increase of revenues from our developments and acquisitions, the increase of our rental income, and on committed projects and capital expenditures; and |
• | other factors, such as changes in regulation (including, in particular, any changes in tax, labor and environmental regulation) or the adoption of other governmental or legislative measures affecting the real estate industry generally or us particularly. |
• | incur additional indebtedness; |
• | repay our debts prior to their stated maturities; |
• | make acquisitions or investments or take advantage of business opportunities; |
• | create or incur additional liens; |
• | divest assets when they are subject to collateral restrictions; |
• | transfer or sell certain assets or merge or consolidate with other entities; |
• | implement mergers, spin-offs or business reorganizations of our business; |
• | enter into certain transactions with affiliates; |
• | sell shares in our subsidiaries and/or enter into joint ventures; and |
• | take certain other corporate actions that would otherwise be desirable. |
• | we may not be able to lease space in our new properties at profitable prices; |
• | we may abandon development opportunities and fail to capitalize on our investments in research and valuation in connection with those opportunities; |
• | we may not be able to obtain or may experience delays in obtaining all of the requisite zoning, building, occupancy and other governmental permits and authorizations; |
• | the feasibility studies for the development of new properties may prove incorrect once the development has commenced; |
• | our business activities may not be as profitable as expected as a result of increased costs of Land Reserves; |
• | actual costs of construction of a project may exceed our original estimates or the construction may not be completed on schedule, for example, as a result of delays attributable to contractual defaults, local climate conditions, nationwide or local strikes by construction workers or shortages of construction materials or electric power or fuel for our equipment, any of which would render the project less profitable or unprofitable; |
• | we may be forced to incur additional costs to correct defects in construction design or that are demanded by our tenants; and |
• | we may be held jointly liable for any underlying soil contamination on any of our properties with the party that caused that contamination, even if that contamination was not identifiable by us. |
• | working to formalize internal control processes and documentation; |
• | working to strengthen supervisory reviews by our management in charge of financial issues; |
• | working to hire additional qualified accounting and finance personnel and to engage financial consultants to enable the implementation of internal control over financial reporting and to segregate duties amongst our accounting and finance personnel; |
• | planning to improve our accounting systems to automate manual processes; and |
• | engaging third parties as required to assist with technical accounting, application of new accounting standards, tax matters, valuations of investment properties, and ESG sustainability metrics, among other matters. |
• | general and industry-specific economic conditions; |
• | differences between our actual financial and operating results and those expected by investors; |
• | investors’ perceptions of our prospects and the prospects of the industries in which we operate; |
• | our financial performance and changes in financial estimates or recommendations by securities analysts or failure to meet analysts’ performance expectations; |
• | the occurrence of health threats; |
• | new conflicts or the escalation of existing conflicts around the world; |
• | new laws or regulations or new interpretations of existing laws and regulations, including tax guidelines, environmental matters and regulation on investment applicable to the real estate industry and our business and our common shares and ADSs; |
• | regulatory developments affecting us or our industry; |
• | new accounting policies and pronouncements; |
• | general economic trends in the U.S., Latin American or global economies and financial markets, including those resulting from war, terrorist attacks or responses to those events; |
• | changes in earnings projections or in research reports about us or the Mexican real-estate industry; |
• | security issues in Mexico; |
• | litigation and insolvency proceedings involving Mexican public companies; |
• | measures and guidelines relating to the protection of minority investors in Mexican companies; |
• | liquidity affecting the Mexican stock markets; |
• | media and public speculation; |
• | changes in sovereign ratings or outlooks of Latin American countries, particularly Mexico, or changes in our ratings or outlook or those of other real estate companies; |
• | political conditions or developments in Mexico, the United States and elsewhere; |
• | additions or departures of key members of management; and |
• | any increased indebtedness we may incur in the future. |
• | it is not satisfied with our controls; |
• | it disagrees with our internal control’s documentation, design, operation or review process; or |
• | its interpretation about relevant requirements is different than ours. |
• | any action between us and our shareholders; and |
• | any action between two or more shareholders or groups of shareholders regarding any matters relating to us. |
• | as an ADS holder, we will not treat you as one of our direct shareholders and you may not be able to exercise shareholder rights; |
• | distributions on the common shares represented by your ADSs will be paid to the depositary, and before the depositary makes a distribution to you on behalf of your ADSs, withholding taxes, if any, that must be paid will be deducted and the depositary will be required to convert the pesos received into U.S. dollars. Additionally, if the exchange rate fluctuates significantly during a time when the depositary cannot convert the pesos received into U.S. dollars, or while it holds the pesos, you may lose some or all of the U.S. dollar value of the distribution; |
• | we and the depositary may amend or terminate the deposit agreement without the ADS holders’ consent in a manner that could prejudice the holders of ADSs or that could affect the ability of the holders of ADSs to transfer ADSs; and |
• | the depositary may take other actions inconsistent with the best interests of the holders of ADSs. |
• | from earnings included in year-end audited consolidated financial statements that are approved by shareholders at a duly convened meeting (including retained earnings); |
• | after any existing losses applicable to prior years have been made up or absorbed into shareholders’ equity; |
• | after at least 5% of net profits for the relevant fiscal year have been allocated to a legal reserve, until the amount of the reserve equals 20.0% of a company’s paid-in capital stock; |
• | any other reserves have been created, including a reserve for the repurchase of our own common shares; and |
• | after shareholders have approved the payment of the relevant dividends at a duly convened meeting. |
• | more than 50.0% of the voting power of all our outstanding classes of voting securities (on a combined basis) must be either directly or indirectly owned of record by non-residents of the United States; or |
• | (1) a majority of our executive officers or directors must not be U.S. citizens or residents; (2) more than 50.0% of our assets cannot be located in the United States; and (3) our business must be administered principally outside the United States. |
| | As of September 30, 2023 | ||||
| | Actual | | | As Adjusted | |
| | (millions of US$) | ||||
Cash, cash equivalents and restricted cash | | | 408.2 | | | 547.4 |
Debt: | | | | | ||
Current portion of long-term debt | | | 4.8 | | | 4.8 |
Long-term debt | | | 923.4 | | | 923.4 |
Total debt(1) | | | 928.2 | | | 928.2 |
Stockholders’ equity: | | | | | ||
Capital stock | | | 567.1 | | | 567.1 |
Additional paid-in capital | | | 807.1 | | | 946.3 |
Retained earnings | | | 875.9 | | | 875.9 |
Share-based payments reserve | | | 2.0 | | | 2.0 |
Foreign currency translation | | | (31.4) | | | (31.4) |
Valuation of derivative financial instruments | | | — | | | |
Total stockholders’ equity | | | 2,220.7 | | | 2,359.9 |
Total capitalization | | | 3,148.9 | | | 3,288.1 |
(1) | Amount is net of direct issuance costs. |
Assumed public offering price per ADS | | | US$36.23 |
Net tangible book value per ADS as of September 30, 2023 | | | US$26.55 |
Increase in pro forma net tangible book value per ADS attributable to existing investors | | | US$0.38 |
Pro forma as adjusted net tangible book value per ADS immediately after this offering | | | US$26.93 |
Dilution in pro forma net tangible book value per ADS to new investors in this offering | | | US$9.30 |
| | Price | | | Average Trading Volume(1) | |||||||
Period | | | Maximum | | | Minimum | | | Closing | | ||
| | (in US$) | ||||||||||
Monthly | | | | | | | | | ||||
July 2023 (beginning July 6, 2023) | | | 36.56 | | | 33.46 | | | 36.27 | | | 218,644 |
August 2023 | | | 38.82 | | | 33.47 | | | 37.14 | | | 128,219 |
September 2023 | | | 36.92 | | | 32.77 | | | 32.87 | | | 51,063 |
October 2023 | | | 33.35 | | | 30.00 | | | 31.44 | | | 123,506 |
November 2023 | | | 37.92 | | | 32.13 | | | 37.79 | | | 76,765 |
December 2023 (through December 1, 2023) | | | 37.81 | | | 35.91 | | | 36.23 | | | 103,927 |
Quarterly | | | | | | | | | ||||
3Q 2023 (beginning July 6, 2023) | | | 38.82 | | | 32.77 | | | 32.87 | | | 132,642 |
(1) | Volume = Average of daily volume taking into account only the annual period. |
| | Price | | | Average Trading Volume(1) | |||||||
Period | | | Maximum | | | Minimum | | | Closing | | ||
| | (in pesos) | ||||||||||
Monthly | | | | | | | | | ||||
January 2022 | | | 41.5 | | | 36.7 | | | 38.4 | | | 1,264,459 |
February 2022 | | | 39.5 | | | 35.2 | | | 38.0 | | | 1,037,187 |
March 2022 | | | 39.4 | | | 36.2 | | | 37.5 | | | 2,502,449 |
April 2022 | | | 39.0 | | | 34.8 | | | 37.2 | | | 1,148,219 |
May 2022 | | | 40.5 | | | 36.2 | | | 37.9 | | | 1,666,223 |
June 2022 | | | 40.1 | | | 35.1 | | | 37.6 | | | 1,554,756 |
July 2022 | | | 41.1 | | | 36.7 | | | 39.5 | | | 1,825,001 |
| | Price | | | Average Trading Volume(1) | |||||||
Period | | | Maximum | | | Minimum | | | Closing | | ||
| | (in pesos) | ||||||||||
August 2022 | | | 40.8 | | | 36.8 | | | 38.6 | | | 1,404,714 |
September 2022 | | | 40.1 | | | 36.6 | | | 38.1 | | | 1,612,224 |
October 2022 | | | 44.3 | | | 36.8 | | | 39.3 | | | 2,981,086 |
November 2022 | | | 44.5 | | | 41.6 | | | 43.0 | | | 2,814,617 |
December 2022 | | | 47.6 | | | 43.2 | | | 45.7 | | | 2,453,158 |
January 2023 | | | 52.3 | | | 45.4 | | | 49.0 | | | 2,283,545 |
February 2023 | | | 55.6 | | | 51.2 | | | 53.0 | | | 2,996,167 |
March 2023 | | | 52.3 | | | 50.9 | | | 54.0 | | | 3,104,948 |
April 2023 | | | 55.6 | | | 52.4 | | | 55.0 | | | 2,018,372 |
May 2023 | | | 57.3 | | | 52.5 | | | 55.7 | | | 1,722,844 |
June 2023 | | | 58.9 | | | 54.1 | | | 57.1 | | | 2,588,468 |
July 2023 | | | 61.6 | | | 55.3 | | | 59.1 | | | 3,856,624 |
August 2023 | | | 65.2 | | | 56.6 | | | 60.9 | | | 2,353,216 |
September 2023 | | | 64.6 | | | 57.1 | | | 61.5 | | | 2,948,094 |
October 2023 | | | 60.3 | | | 52.6 | | | 56.9 | | | 3,114,742 |
November 2023 | | | 65.9 | | | 56.1 | | | 62.2 | | | 2,110,610 |
December 2023 (through December 1, 2023) | | | 65.2 | | | 62.2 | | | 63.4 | | | 1,885,394 |
Quarterly | | | | | | | | | ||||
1Q 2022 | | | 41.5 | | | 35.2 | | | 37.9 | | | 1,638,339 |
2Q 2022 | | | 40.5 | | | 34.8 | | | 37.6 | | | 1,461,141 |
3Q 2022 | | | 41.1 | | | 36.6 | | | 38.7 | | | 1,607,612 |
4Q 2022 | | | 47.6 | | | 36.8 | | | 42.7 | | | 2,746,059 |
1Q 2023 | | | 57.1 | | | 45.4 | | | 52.0 | | | 2,785,302 |
2Q 2023 | | | 58.9 | | | 52.4 | | | 56.0 | | | 2,115,799 |
3Q 2023 | | | 65.2 | | | 56.0 | | | 60.6 | | | 2,805,617 |
Annual | | | | | | | | | ||||
2020 | | | 40.6 | | | 23.5 | | | 33.4 | | | 1,599,808 |
2021 | | | 45.6 | | | 34.3 | | | 38.9 | | | 1,290,927 |
2022 | | | 47.6 | | | 34.8 | | | 39.2 | | | 1,863,169 |
(1) | Volume = Average of daily volume taking into account only the annual period. |
• | an annual report for the immediately preceding fiscal year prepared in accordance with the CNBV’s general regulations by no later than April 30 of each year; |
• | quarterly reports, within 20 business days following the end of each of the first three quarters and 40 business days following the end of the fourth quarter; |
• | reports disclosing material events promptly upon their occurrence; |
• | reports regarding corporate restructurings, such as mergers, acquisitions, spin-offs or asset sales approved at shareholders’ meetings or by the board of directors; |
• | a summary of the resolutions adopted at any shareholders’ meeting, on the business day immediately following the date of that meeting; and |
• | disclosure in respect of certain material agreements among shareholders. |
• | the issuer maintains adequate confidentiality measures (including maintaining records of persons or entities in possession of material non-public information); |
• | the information is related to transactions that have not been completed; |
• | there is no misleading public information relating to the material event; and |
• | no unusual price or volume fluctuation occurs. |
• | if the issuer does not disclose a material event or to comply with reporting obligations; |
• | upon price or volume volatility or changes in the offer or demand for those shares that are not consistent with their historic performance and cannot be explained solely through information made publicly available pursuant to the CNBV’s general regulations; |
• | to prevent disorderly market conditions; or |
• | technological contingencies in the operational systems of the BMV. |
• | members and the secretary of a public entity’s board of directors, its statutory auditor, the chief executive officer and other officers, as well as the external auditors; |
• | any person that, directly or indirectly, controls 10.0% or more of a listed issuer’s outstanding share capital; |
• | members and the secretary of the board of directors, the statutory auditor, the chief executive officer and other officers of companies that, directly or indirectly, control 10.0% or more of a listed issuer’s outstanding share capital; |
• | any person or group of persons who have a significant influence over the issuer and, if applicable, in the companies of the business group or consortium to which the issuer belongs; and |
• | any person who carries out transactions with securities that deviate from their historical investment patterns in the market and who may reasonably have had access to privileged information through the persons referred to in the preceding sections. |
Period | | | Spread | | | Share of Trading Volume |
January 2022 | | | 98,203 | | | 0.23% |
February 2022 | | | 93,211 | | | 0.24% |
March 2022 | | | 144,371 | | | 0.19% |
April 2022 | | | 115,510 | | | 0.22% |
May 2022 | | | 103,433 | | | 0.24% |
June 2022 | | | 162,069 | | | 0.22% |
July 2022 | | | 120,209 | | | 0.20% |
August 2022 | | | 119,454 | | | 0.17% |
September 2022 | | | 122,765 | | | 0.16% |
October 2022 | | | 101,773 | | | 0.12% |
November 2022 | | | 111,781 | | | 0.12% |
December 2022 | | | 137,402 | | | 0.13% |
Average | | | 119,182 | | | 0.19% |
January 2023 | | | 126,227 | | | 6.77% |
February 2023 | | | 125,691 | | | 4.57% |
March 2023 | | | 149,333 | | | 4.43% |
April 2023 | | | 131,024 | | | 4.42% |
May 2023 | | | 152,250 | | | 4.01% |
June 2023 | | | 197,092 | | | 4.12% |
July 2023 | | | 179,172 | | | 3.01% |
August 2023 | | | 184,353 | | | 5.13% |
September 2023 | | | 196,974 | | | 4.71% |
October 2023 | | | 302,178 | | | 3.76% |
Average | | | 174,429 | | | 4.49% |
| | As of September 30, | | | As of December 31, | ||||
| | 2023 | | | 2022 | | | 2021 | |
Number of real estate properties | | | 213 | | | 202 | | | 189 |
GLA (sq. feet)(1) | | | 36,905,960 | | | 33,714,370 | | | 31,081,746 |
Leased area (sq. feet)(2) | | | 34,128,931 | | | 32,054,026 | | | 29,257,404 |
Number of tenants | | | 192 | | | 183 | | | 175 |
Average rent per square foot (US$ per year)(3) | | | 5.4 | | | 5.0 | | | 4.5 |
Weighted average remaining lease term (years) | | | 5.5 | | | 4.9 | | | 4.3 |
Collected rental revenues per square foot (US$ per year)(4) | | | 5.4 | | | 4.7 | | | 4.7 |
Stabilized Occupancy rate (% of GLA)(5) | | | 97.3 | | | 97.3 | | | 94.3 |
(1) | Refers to the total GLA across all of our real estate properties. |
(2) | Refers to the GLA that was actually leased to tenants as of the dates indicated. |
(3) | Calculated as the annual base rent as of the end of the relevant period divided by the GLA. For rents denominated in pesos, annual rent is converted to US$ at the average exchange rate for each quarter. |
(4) | Calculated as the annual income collected from rental revenues during the relevant period divided by the square feet leased. For income collected denominated in pesos, income collected is converted to US$ at the average exchange rate for each quarter. |
(5) | We calculate stabilized occupancy rate as leased area divided by total GLA. We deem a property to be stabilized once it has reached 80.0% occupancy or has been completed for more than one year, whichever occurs first. |
• | Level 1 fair value measurements are those derived from quoted prices (unadjusted) in active markets for identical assets or liabilities that we can access at the measurement date; |
• | Level 2 fair value measurements are those derived from inputs, other than quoted prices included within Level 1, that are observable for the asset or liability, either directly or indirectly; and |
• | Level 3 fair value measurements are those derived from valuation techniques that include inputs for the asset or liability that are not based on observable market data. |
• | interest income: interest income consists of interest earned on our cash and cash equivalents; |
• | other income: other income includes (i) nonrecurring items related to acquisitions of shares of other companies, and (ii) other miscellaneous items such as inflation and interest on recoverable income taxes; |
• | finance cost: interest expense primarily includes accrued interest on our debt and other financing-related expenses; |
• | exchange gain: based on the primary economic environment in which we operate, our management has determined that the U.S. dollar is the functional currency of Vesta and all of its subsidiaries except for WTN, which considers the peso to be its functional currency. Therefore, exchange gain represents the effect of changes in exchange rates on monetary assets and liabilities denominated in pesos held by Vesta and all of its subsidiaries except for WTN. It also includes the effects of changes in exchange rates on U.S. dollar-denominated indebtedness of WTN. We recognize an exchange gain or loss depending on whether we hold monetary assets or liabilities denominated in pesos and whether the peso appreciates or depreciates against the U.S. dollar; and |
• | gain on revaluation of investment property: gain on revaluation of investment property is the gain derived as a result of changes in the fair value of our investment properties as determined by independent appraisers. The appraisals are performed on a quarterly basis. We record a gain on revaluation of investment property for years in which the fair value of our properties increases as compared to the previous year, or a loss on revaluation of investment property if the fair value decreases. |
| | For the Three-Month Period Ended September 30, | | | For the Nine-Month Period Ended September 30, | | | For the Year Ended December 31, | ||||||||||
| | 2023 | | | 2022 | | | 2023(1) | | | 2022 | | | 2022 | | | 2021 | |
| | (millions of US$, except per share data) | ||||||||||||||||
Revenue: | | | | | | | | | | | | | ||||||
Rental income | | | 55.8 | | | 45.5 | | | 157.6 | | | 130.6 | | | 178.0 | | | 160.7 |
Management fees | | | 0.6 | | | — | | | 0.9 | | | — | | | — | | | 0.1 |
| | | | | | | | | | | | |||||||
Property operating costs related to properties that generated rental income | | | (4.4) | | | (2.3) | | | (10.3) | | | (6.1) | | | (8.9) | | | (8.5) |
Property operating costs related to properties that did not generate rental income | | | (1.4) | | | (0.6) | | | (3.0) | | | (1.5) | | | (2.5) | | | (2.2) |
General and administrative expenses | | | (7.3) | | | (5.9) | | | (22.3) | | | (18.5) | | | (24.4) | | | (21.4) |
| | | | | | | | | | | | |||||||
Interest income | | | 4.4 | | | 1.4 | | | 5.5 | | | 1.5 | | | 2.6 | | | 0.1 |
Other income – net | | | 1.7 | | | 0.3 | | | 2.4 | | | 0.6 | | | 1.0 | | | — |
Finance costs | | | (11.4) | | | (11.8) | | | (34.7) | | | (34.1) | | | (46.4) | | | (50.3) |
Exchange gain (loss) – net | | | (2.2) | | | (0.9) | | | 6.2 | | | (0.3) | | | 1.9 | | | (1.1) |
Gain on sale of investment property | | | — | | | — | | | — | | | 5.0 | | | 5.0 | | | 14.0 |
Gain on revaluation of investment property | | | 95.2 | | | 63.0 | | | 179.5 | | | 139.8 | | | 185.5 | | | 164.6 |
Profit before income taxes | | | 131.0 | | | 88.7 | | | 281.8 | | | 217.0 | | | 291.8 | | | 256.0 |
Total income tax expense | | | (54.8) | | | (26.7) | | | (79.0) | | | (52.1) | | | (48.2) | | | (82.1) |
Profit for the period | | | 76.2 | | | 62.0 | | | 202.8 | | | 164.9 | | | 243.6 | | | 173.9 |
Other comprehensive income (loss) – net of tax: | | | | | | | | | | | | | ||||||
Items that may be reclassified subsequently to profit – Fair value gain on derivative instruments | | | — | | | — | | | — | | | — | | | — | | | 2.9 |
Exchange differences on translating other functional currency operations | | | 2.8 | | | 0.3 | | | 9.4 | | | 3.0 | | | 8.9 | | | (4.8) |
Total other comprehensive income | | | 2.8 | | | 0.3 | | | 9.4 | | | 3.0 | | | 8.9 | | | (2.0) |
Total comprehensive income for the period | | | 79.0 | | | 62.3 | | | 212.2 | | | 168.0 | | | 252.5 | | | 172.0 |
| | | | | | | | | | | | |||||||
Basic earnings per share | | | 0.0928 | | | 0.0912 | | | 0.2777 | | | 0.2413 | | | 0.3569 | | | 0.2683 |
Diluted earnings per share | | | 0.0914 | | | 0.0896 | | | 0.2734 | | | 0.2373 | | | 0.3509 | | | 0.2636 |
(1) | Per share data includes the effects of Vesta’s initial public offering of 125,000,000 Common Shares on July 5, 2023. |
• | an increase of US$20.6 million, or 13.0%, in rental income from the leasing of new spaces or spaces that were vacant during the nine-month period ended September 30, 2022; |
• | an increase of US$6.4 million, or 4.1%, in rental income resulting from increases on rent per adjustments for inflation in accordance with our leases; |
• | an increase of US$2.2 million, or 1.4%, due to the currency translation effects of leases denominated in Mexican pesos; and |
• | an increase of US$3.7 million, or 2.3%, resulting from the reimbursement of expenses paid by us on behalf of our customers and accounted for under rental income. |
• | a decrease of US$5.9 million, or 3.7%, in rental income from leases that expired and were not renewed during the nine-month period ended September 30, 2023. |
• | an increase of US$7.8 million, or 13.9%, in rental income from the leasing of new spaces or spaces that were vacant during the three-month period ended September 30, 2022; |
• | an increase of US$2.2 million, or 3.9%, in rental income resulting from increases on rent per adjustments for inflation in accordance with our leases; |
• | an increase of US$1.0 million, or 1.8%, due to the currency translation effects of leases denominated in Mexican pesos; and |
• | an increase of US$1.4 million, or 2.6%, resulting from the reimbursement of expenses paid by us on behalf of our customers and accounted for under rental income. |
• | a decrease of US$2.2 million, or 3.9%, in rental income from leases that expired and were not renewed during the three-month period ended September 30, 2023. |
• | an increase of US$19.4 million, or 12.0%, in rental income from the leasing of new spaces or spaces that were vacant during 2021; |
• | an increase of US$8.7 million, or 5.4%, in rental income resulting from increases on rent from adjustments for inflation in accordance with our leases; |
• | an increase US$2.7 million, or 40.6%, resulting from the reimbursement of expenses paid by us on behalf of our customers and accounted for under rental income; and |
• | an increase of US$0.3 million, or 0.2%, due to the currency translation effects of leases denominated in Mexican pesos. |
• | a decrease of US$7.8 million in lost lease revenue from properties sold during 2021; |
• | a decrease of US$5.6 million, or 3.5%, in rental income from leases that expired during 2021 and were not renewed for 2022; and |
• | a decrease of US$0.3 million, or 0.2%, in rental income as a result of rental rate reductions agreed upon renewal of our leases in order to retain customers. |
• | a decrease of US$0.1 million, or 3.0%, in real estate taxes due to higher prompt payment discounts in 2022, to US$1.8 million for 2022 from US$1.9 million for 2021; |
• | an increase of US$64,827, or 4.2%, in maintenance costs, to US$1.6 million for 2022 from US$1.6 million for 2021; |
• | an increase of US$0.3 million or 8.1% in other property related expenses. |
• | a US$0.2 million decrease in real estate taxes, to US$0.3 million for the year ended December 31, 2022 from US$0.5 million for the year ended December 31, 2021; |
• | a US$0.4 million increase in other property related expenses. |
• | US$16.1 million related to a benefit for: (i) the effect of changes in exchange rates used to convert the carrying amount of our assets (including investment property and net tax loss carryforwards) for tax purposes, from Mexican pesos to U.S. dollars, as of the end of the year, (ii) a benefit from the impact of inflation on the carrying amount of our assets (including investment property and net tax loss |
• | US$4.3 million related to a benefit for the updated treatment of debt issuance cost according to tax rules applicable for 2022; |
• | US$1.2 million benefit resulting from the derecognition of forward contract deferrals during 2022; and |
• | US$3.3 million benefit related to currency translation of WTN. |
• | US$0.4 million benefit related to the decrease on our reserves on lease receivables. |
• | US$0.2 million benefit related to a larger accrual of employee benefits. |
| | For the Nine-Month Period Ended September 30, | | | For the Year Ended December 31, | |||||||
| | 2023 | | | 2022 | | | 2022 | | | 2021 | |
| | | | | | (millions of US$) | ||||||
Net cash generated (used) by operating activities | | | 128.9 | | | 75.5 | | | 65.2 | | | 107.9 |
Net cash (used) generated by investing activities | | | (195.8) | | | (168.3) | | | (262.2) | | | 16.0 |
Net cash (used) generated by financing activities | | | 344.6 | | | (91.0) | | | (119.8) | | | 212.5 |
Effects of exchange rates changes on cash | | | (8.7) | | | 1.7 | | | 3.1 | | | (4.1) |
Net (decrease) increase in cash, cash equivalents and restricted cash | | | 269.0 | | | (182.1) | | | (313.7) | | | 332.3 |
| | Original Principal Amount | | | | | | | Principal Amount Outstanding as of September 30, | ||||||
| | Annual Interest Rate | | | Maturity | | | 2023 | | | 2022 | ||||
| | (millions of US$) | | | | | | | (millions of US$) | ||||||
Loan/Notes | | | | | | | | | | | |||||
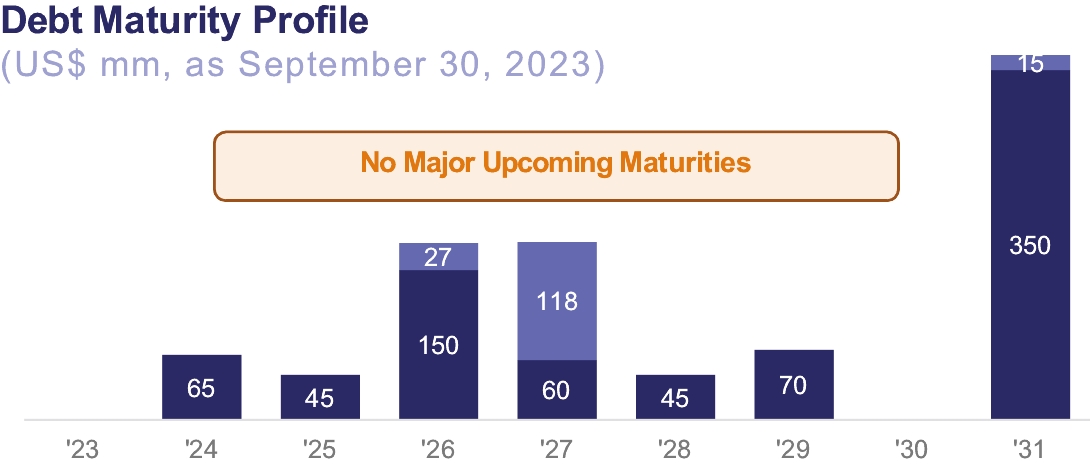
2016 MetLife 10-year Loan | | | 150.0 | | | 4.55% | | | Aug. 2026 | | | 144.9 | | | 147.3 |
2017 Series A Senior Notes | | | 65.0 | | | 5.03% | | | Sept. 2024 | | | 65.0 | | | 65.0 |
2017 Series B Senior Notes | | | 60.0 | | | 5.31% | | | Sept. 2027 | | | 65.0 | | | 60.0 |
2018 Series A Senior Notes | | | 45.0 | | | 5.50% | | | May 2025 | | | 45.0 | | | 45.0 |
2018 Series B Senior Notes | | | 45.0 | | | 5.85% | | | May 2028 | | | 45.0 | | | 45.0 |
2017 MetLife 10-year Loan | | | 118.0 | | | 4.75% | | | Dec. 2027 | | | 116.6 | | | 118.0 |
2018 MetLife 8-year Loan | | | 26.6 | | | 4.75% | | | Aug. 2026 | | | 25.7 | | | 26.1 |
Series RC Senior Notes | | | 70.0 | | | 5.18% | | | June 2029 | | | 70.0 | | | 70.0 |
Series RD Senior Notes | | | 15.0 | | | 5.28% | | | June 2031 | | | 15.0 | | | 15.0 |
Sustainability-linked Senior Notes | | | 350.0 | | | 3.625% | | | May 2031 | | | 350.0 | | | 350.0 |
Sustainability-linked Revolving Credit Facility | | | 200.0 | | | SOFR plus 160 basis points(1) | | | Aug. 2025 | | | — | | | — |
(-) Less: Current portion | | | | | | | | | 4.8 | | | 2.7 | |||
(-) Less: Direct issuance cost | | | | | | | | | 9.0 | | | 10.0 | |||
Total long-term debt | | | | | | | | | 923.4 | | | 928.7 |
(1) | Interest rate may increase if our leverage ratio exceeds 40.0%. For more information, see “—Sustainability-linked Revolving Credit Facility.” |
• | merge with or into another entity; |
• | undergo a change of control; |
• | incur additional indebtedness and liens, subject to certain exceptions; |
• | make asset sales, subject to certain exceptions; |
• | make dividend and similar payments and prepayments of certain unsecured indebtedness; and |
• | make investments in any of the following types of properties if the applicable percentage of our total asset value set forth below pertaining to such type of investment would be exceeded immediately following that investment: |
• | investments in raw or undeveloped land exceeding in aggregate 15% of our total asset value; |
• | investments in development properties exceeding in aggregate 20.0% of our total asset value; |
• | investments in joint ventures exceeding in aggregate 10.0% of our total asset value; |
• | investments in direct and indirect interests in real property (other than as stated above) exceeding in aggregate 3% of our total asset value; and |
• | investments in any of the types of property described above exceeding in aggregate 35% of our total asset value. |
• | maintain the collateral securing the notes; |
• | comply with reporting requirements in connection with our financial and operational results; |
• | maintain the following financial ratios: |
• | a minimum equity value of not less than (i) US$848.8 million, plus (ii) 70.0% of the net proceeds of all offerings of our equity interests (excluding any net proceeds applied to repurchases of any of our equity interests) at all times; |
• | a leverage ratio not exceeding 50.0% on any test date; |
• | a ratio of secured debt to total asset value not exceeding 40.0% on any test date; |
• | a ratio of unsecured debt to unencumbered asset value not exceeding 50.0% on any test date; |
• | a fixed charge coverage ratio greater than 1.5 to 1.0 on any test date; and |
• | a ratio of unencumbered property adjusted net operating income to debt service greater than 1.6 to 1.0 on any test date. |
| | | | Payments Due by Period | |||||||||||
| | Total | | | Less than 1 year | | | 1 to 3 years | | | 3 to 5 years | | | More than 5 years | |
| | | | | | (millions of US$) | | | |||||||
Current portion of long-term debt | | | 4.8 | | | 4.8 | | | — | | | — | | | — |
Long-term debt | | | 932.4 | | | — | | | 119.5 | | | 377.9 | | | 435.0 |
Total | | | 937.2(1) | | | 4.8 | | | 119.5 | | | 377.9 | | | 435.0 |
(1) | Includes debt issuance costs. |
| | For the Nine-Month Period Ended September 30, | | | For the Year Ended December 31, | |||||||
| | 2023 | | | 2022 | | | 2022 | | | 2021 | |
| | | | (millions of US$) | | | ||||||
Profit or loss impact: | | | | | | | | | ||||
Peso – 10.0% appreciation – gain | | | (0.5) | | | 1.7 | | | 0.2 | | | (0.2) |
Peso – 10.0% depreciation – loss | | | 0.6 | | | (2.1) | | | (0.2) | | | 0.3 |
U.S. dollar – 10.0% appreciation – loss | | | (53.7) | | | (62.4) | | | (59.5) | | | (65.0) |
U.S. dollar – 10.0% appreciation – gain | | | 53.7 | | | 62.4 | | | 59.5 | | | 65.0 |
• | our business and strategy of investment strategy of investing in industrial facilities, which may subject us to risks of the sector in which we operate but uncommon to other companies that invest primarily in a broader range of real estate assets; |
• | our ability to maintain or increase our rental rates and occupancy rates; |
• | the performance and financial condition of our tenants; |
• | our expectations regarding income, expenses, sales, operations and profitability; |
• | higher interest rates, increased leasing costs, increased construction costs, distressed supply chains for construction materials, increased maintenance costs, all of which could increase our costs and limit our ability to acquire or develop additional real estate assets; |
• | our ability to obtain returns from our projects similar or comparable to those obtained in the past; |
• | our ability to successfully expand into new markets in Mexico; |
• | our ability to successfully engage in property development; |
• | our ability to lease or sell any of our properties; |
• | our ability to successfully acquire land or properties to be able to execute on our accelerated growth strategy; |
• | the competition within our industry and markets in which we operate; |
• | economic trends in the industries or the markets in which our customers operate; |
• | the continuing impact of the COVID-19 pandemic and the impact of any other pandemics, epidemics or outbreaks of infectious diseases on the Mexican economy and on our business, results of operations, financial condition, cash flows and prospects, as well as our ability to implement any necessary measures in response to such impact; |
• | loss of any significant customers; |
• | the terms of laws and government regulations that affect us, and interpretations of those laws and regulations, including changes in tax laws and regulations applicable to our subsidiaries, such as increases in real property tax rates, and changes in environmental, labor, real estate and zoning laws; |
• | deterioration of labor relations with third-party contractors, changes in labor costs and labor difficulties, including subcontracting reforms in Mexico comprising changes to labor and social laws; |
• | supply of utilities, including electricity and water, and availability of public services, to support the operations of our tenants in our properties and industrial parks; |
• | political and social developments in Mexico, including political instability, currency devaluation, inflation and unemployment; |
• | the performance of the Mexican economy and the global economy; |
• | the competitiveness of Mexico as an exporter of manufactured and other products to the United States and other key markets; |
• | limitations on our access to sources of financing on competitive terms; |
• | our ability to service our debt; |
• | the performance of financial markets and our ability to refinance our financial obligations as needed; |
• | changes in capital markets that might affect the investment policies or attitude in Mexico or regarding securities issued by Mexican companies; |
• | obstacles to commerce, including tariffs or import taxes and changes to the existing commercial policies, and change or withdrawal from free trade agreements, including the USMCA, of which Mexico is a member that might negatively affect our current or potential clients or Mexico in general; |
• | increase of trade flows and the formation of trade corridors connecting certain geographic areas of Mexico and the U.S., which results in a vigorous economic activity within those areas in Mexico and a source of demand for industrial buildings; |
• | a negative change in our public image; |
• | epidemics, catastrophes, insecurity and other events that might affect the regional or national consumption; |
• | the loss of key executives or personnel; |
• | restrictions on foreign currency convertibility and remittance outside Mexico; |
• | our ability to execute our corporate strategies; |
• | changes in exchange rates, market interest rates or the rate of inflation; |
• | the growth of e-commerce markets; |
• | possible disruptions to commercial activities due to acts of God and natural and human-induced disasters that could affect our properties in Mexico, including criminal activity relating to drug trafficking, terrorist activities, and armed conflicts; and |
• | the effect of changes to the applicable tax legislation or regulations, including amendments to the laws that are applicable to our business or our clients’ businesses, changes in accounting principles, new legislation, intervention by regulatory authorities, government directives and monetary or fiscal policy in Mexico. |
• | geopolitical tensions between the U.S. and China leading to relocation of Asia-based operations to North America; |
• | pandemic-disrupted supply chains, including shortages of raw materials and manufacturing components; |
• | a challenging labor and logistics environment in the U.S.; and |
• | the Russia-Ukraine conflict. |
• | Governance and integrity: (i) 100.0% of investment decisions under responsible investment guidelines, including the UN PRI, (ii) establish ESG commitments with 35% of our total supply chain, and (iii) additional women as permanent members of our Board of Directors, consistent with global trends; |
• | Social: (i) achieve strategic alliances for our ESG projects (for example, with local communities and other private organizations), consisting of increasing the total impact of the initiatives, both in terms of people and size of projects, (ii) firm-wide continuous training in ESG practices, and (iii) reduce salary gender gap, primarily at the management level; and |
• | Environment: (i) reduce carbon footprint and water consumption in areas of real estate development managed or to be managed by Vesta, (ii) increase waste recycled by Vesta, (iii) identify all physical and transitional risks of our portfolio and operations to determine mitigation and prevention actions, and (iv) increase the percentage of our GLA to have green certifications, such as LEED, BOMA and EDGE. |
• | First, we aim to manage, maintain, and improve our current portfolio quality in terms of age, tenants, sustainability and industry diversification through refurbishments and new developments, acquisitions and selected dispositions. We plan to focus on our leasing and commercial efforts to maintain healthy contract profile terms, while increasing net effective rents and maintaining a tenant base with high creditworthiness. |
• | Second, we seek to invest and/or divest for continued value creation, incorporating prudent investment guidelines in our investment decisions and asset sales. We plan to (i) grow our foothold in companies engaged or that participate in e-commerce and in the main metropolitan areas, (ii) continue to invest at an appropriate pace in our core markets in which we believe we hold strong positions, with an emphasis in Northern Mexico; and (iii) continuously monitor market conditions and business fundamentals to optimize investments and asset sales. |
• | Third, we plan to continue strengthening our balance sheet and expanding our funding sources by recycling capital and raising equity and debt. We aim to extend our maturities and increase our investment capacity to capitalize on attractive opportunities. Capital recycling will continue through our selective asset dispositions, joint ventures and other alternative funding sources, if needed. |
• | Fourth, we seek to strengthen our organization to execute our business strategy successfully. We intend to continue reinforcing our asset management and commercial teams and resources, building a highly qualified bench for top and middle management succession over time, implementing a new information technology platform to develop further our innovation capabilities and enhancing our incentive alignment between management and stakeholders. |
• | Fifth, as part of our recognition of the importance of ethical and sustainable standards, we strive to become a leader in ESG practices, embedding sustainable and resilient practices in our business model. We will continue working to reduce significantly our impact on the environment, increase the efficiency of our buildings and promote reductions in the carbon footprint of our tenant base. We will also continue strengthening our corporate governance, including our ESG committees and working groups, and expand our social programs to enhance the social dimension of our infrastructure, human resources policies and other third-party relationships. |
| | As of September 30, | | | As of December 31, | ||||
| | 2023 | | | 2022 | | | 2021 | |
Number of real estate properties | | | 213 | | | 202 | | | 189 |
GLA (sq. feet)(1) | | | 36,905,960 | | | 33,714,370 | | | 31,081,746 |
Leased area (sq. feet)(2) | | | 34,128,931 | | | 32,054,026 | | | 29,257,404 |
Number of tenants | | | 192 | | | 183 | | | 175 |
Average rent per square foot (US$ per year)(3) | | | 5.4 | | | 5.0 | | | 4.5 |
Weighted average remaining lease term (years) | | | 5.5 | | | 4.9 | | | 4.3 |
Collected rental revenues per square foot (US$ per year)(4) | | | 5.4 | | | 4.7 | | | 4.7 |
Stabilized Occupancy rate (% of GLA)(5) | | | 97.3 | | | 97.3 | | | 94.3 |
(1) | Refers to the total GLA across all of our real estate properties. |
(2) | Refers to the GLA that was actually leased to tenants as of the dates indicated. |
(3) | Calculated as the annual base rent as of the end of the relevant period divided by the GLA. For rents denominated in pesos, annual rent is converted to US$ at the average exchange rate for each quarter. |
(4) | Calculated as the annual income collected from rental revenues during the relevant period divided by the square feet leased. For income collected denominated in pesos, income collected is converted to US$ at the average exchange rate for each quarter. |
(5) | We calculate stabilized occupancy rate as leased area divided by total GLA. We deem a property to be stabilized once it has reached 80.0% occupancy or has been completed for more than one year, whichever occurs first. |
| | Project | | | Project GLA | | | Total Expected Investment (Thousand US$)(1) | | | Investment to Date (Thousand US$) | | | Leased | | | Expected Completion Date | | | Type | |||||||||||||
| Land + Infrastructure | | | Shell(2) | | | Total | | | Land + Infrastructure | | | Shell(2) | | | Total | | ||||||||||||||||
| | | | (in square feet) | | | (US$) | | | (US$) | | | (US$) | | | (US$) | | | (US$) | | | (US$) | | | (%) | | | | | ||||
North Region | | | | | | | | | | | | | | | | | | | | | | | |||||||||||
Ciudad Juárez | | | Juárez Oriente 3 | | | 283,338 | | | 7,121 | | | 14,050 | | | 21,171 | | | 240,837 | | | 2,136 | | | 242,973 | | | 0.0 | | | July 2024 | | | Inventory |
Ciudad Juárez | | | Juárez Oriente 4 | | | 297,741 | | | 7,482 | | | 14,801 | | | 22,283 | | | 253,080 | | | 2,245 | | | 255,325 | | | 0.0 | | | July 2024 | | | Inventory |
Ciudad Juárez | | | Juárez Oriente 5 | | | 210,800 | | | 5,298 | | | 11,353 | | | 16,651 | | | 179,180 | | | 2,119 | | | 181,299 | | | 100.0 | | | June 2024 | | | BTS |
| | | | 791,879 | | | 19,901 | | | 40,204 | | | 60,105 | | | 673,097 | | | 6,500 | | | 679,597 | | | 26.6 | | | | | ||||
Bajío Region | | | | | | | | | | | | | | | | | | | | | | | |||||||||||
Guadalajara | | | GDL 08 | | | 680,333 | | | 15,386 | | | 27,911 | | | 43,297 | | | 340,166 | | | 14,310 | | | 354,476 | | | 0.0 | | | October 2023 | | | Inventory |
Aguascalientes | | | Aguascalientes 3 | | | 200,318 | | | 1,746 | | | 10,365 | | | 12,111 | | | 180,286 | | | 524 | | | 180,810 | | | 31.0 | | | July 2024 | | | Inventory |
SLP | | | San Luis Potosí 4 | | | 262,532 | | | 2,588 | | | 13,210 | | | 15,798 | | | 236,279 | | | 776 | | | 237,055 | | | 0.0 | | | July 2024 | | | Inventory |
SLP | | | Tres Naciones 10 | | | 131,571 | | | 1,140 | | | 7,183 | | | 8,323 | | | 131,571 | | | 342 | | | 131,913 | | | 0.0 | | | May 2024 | | | Inventory |
Querétaro | | | Querétaro 6 | | | 214,760 | | | 2,434 | | | 9,892 | | | 12,326 | | | 214,760 | | | 1,122 | | | 215,882 | | | 100.0 | | | January 2024 | | | BTS |
| | | | 1,489,514 | | | 23,294 | | | 68,561 | | | 91,855 | | | 1,103,062 | | | 17,074 | | | 1,120,136 | | | 18.6 | | | | | ||||
Central Region | | | | | | | | | | | | | | | | | | | | | | | |||||||||||
Valle de México | | | La Villa | | | 213,065 | | | 22,086 | | | 10,012 | | | 32,098 | | | 181,105 | | | 6,626 | | | 187,731 | | | 0.0 | | | May 2024 | | | Inventory |
Valle de México | | | Punta Norte 1 | | | 845,957 | | | 50,582 | | | 37,905 | | | 88,487 | | | 575,250 | | | 15,175 | | | 590,425 | | | 0.0 | | | December 2024 | | | Inventory |
Valle de México | | | Punta Norte 2 | | | 171,286 | | | 10,241 | | | 8,408 | | | 18,649 | | | 116,475 | | | 3,072 | | | 119,547 | | | 0.0 | | | October 2024 | | | Inventory |
| | | | 1,230,308 | | | 82,909 | | | 56,325 | | | 139,234 | | | 872,830 | | | 24,873 | | | 897,703 | | | 0.0 | | | | | ||||
| | | | 3,511,701 | | | 126,104 | | | 165,090 | | | 291,194 | | | 2,648,989 | | | 48,447 | | | 2,697,436 | | | 13.9 | | | | |
(1) | Total Expected Investment comprises our material cash requirements, including commitments for capital expenditures. |
(2) | A shell is typically comprised by the primary structure, the building envelope (roof and façade), mechanical and supply systems (electricity, water and drainage) up to a single point of contact. |
| | Location | | | Total GLA | | | Total GLA | | | Percentage of Portfolio GLA | | | Rental Income for the Three Months Ended September 30, 2023 | | | Percentage of Rental Income for the Three Months Ended September 30, 2023 | | | Operations Start Year | | | Number of Buildings | | | Appraisal Value as of September 30, 2023 | |
| | | | (in square feet) | | | (in square meters) | | | (%) | | | (US$) | | | (%) | | | | | | | (US$) | ||||
Industrial Park | | | | | | | | | | | | | | | | | | | |||||||||
DSP | | | Aguascalientes | | | 2,143,262 | | | 199,116 | | | 5.8 | | | 3,183,011 | | | 5.6 | | | 2013 | | | 8 | | | 137,700,000 |
Vesta Park Aguascalientes | | | Aguascalientes | | | 306,804 | | | 28,503 | | | 0.8 | | | 383,526 | | | 0.7 | | | 2019 | | | 2 | | | 18,500,000 |
Los Bravos Vesta Park | | | Cd Juárez | | | 460,477 | | | 42,780 | | | 1.2 | | | 685,568 | | | 1.2 | | | 2007 | | | 4 | | | 30,390,000 |
Vesta Park Juárez Sur I | | | Cd Juárez | | | 1,514,249 | | | 140,678 | | | 4.1 | | | 2,403,832 | | | 4.3 | | | 2015 | | | 8 | | | 113,030,000 |
Vesta Park Guadalajara | | | Guadalajara | | | 2,572,897 | | | 239,030 | | | 7.0 | | | 3,906,632 | | | 6.9 | | | 2020 | | | 6 | | | 230,650,000 |
Vesta Park Guadalupe | | | Monterrey | | | 497,929 | | | 46,259 | | | 1.3 | | | 1,350,665 | | | 2.4 | | | 2021 | | | 2 | | | 32,560,000 |
Vesta Puebla I | | | Puebla | | | 1,028,801 | | | 95,579 | | | 2.8 | | | 1,783,006 | | | 3.2 | | | 2016 | | | 5 | | | 86,150,000 |
Bernardo Quintana | | | Querétaro | | | 772,025 | | | 71,723 | | | 2.1 | | | 611,242 | | | 1.1 | | | 1998 | | | 9 | | | 39,840,000 |
PIQ | | | Querétaro | | | 2,109,491 | | | 195,978 | | | 5.7 | | | 2,982,995 | | | 5.3 | | | 2006 | | | 13 | | | 138,750,000 |
VP Querétaro | | | Querétaro | | | 923,238 | | | 85,772 | | | 2.5 | | | 742,069 | | | 1.3 | | | 2018 | | | 4 | | | 53,000,000 |
Querétaro Aerospace Park | | | Querétaro Aero | | | 2,337,248 | | | 217,137 | | | 6.3 | | | 3,800,159 | | | 6.7 | | | 2007 | | | 13 | | | 164,550,000 |
| | Location | | | Total GLA | | | Total GLA | | | Percentage of Portfolio GLA | | | Rental Income for the Three Months Ended September 30, 2023 | | | Percentage of Rental Income for the Three Months Ended September 30, 2023 | | | Operations Start Year | | | Number of Buildings | | | Appraisal Value as of September 30, 2023 | |
| | | | (in square feet) | | | (in square meters) | | | (%) | | | (US$) | | | (%) | | | | | | | (US$) | ||||
SMA | | | San Miguel de Allende | | | 1,361,708 | | | 126,507 | | | 3.7 | | | 1,529,865 | | | 2.7 | | | 2015 | | | 7 | | | 88,700,000 |
Las Colinas | | | Silao | | | 903,487 | | | 83,937 | | | 2.4 | | | 1,210,926 | | | 2.1 | | | 2008 | | | 7 | | | 57,750,000 |
Vesta Park Puento Interior | | | Silao | | | 1,312,047 | | | 121,893 | | | 3.6 | | | 1,661,113 | | | 2.9 | | | 2018 | | | 7 | | | 79,800,000 |
Tres Naciones | | | San Luis Potosí | | | 960,964 | | | 89,276 | | | 2.6 | | | 1,383,548 | | | 2.5 | | | 1999 | | | 9 | | | 63,550,000 |
Vesta Park SLP | | | San Luis Potosí | | | 603,385 | | | 56,056 | | | 1.6 | | | 615,708 | | | 1.1 | | | 2018 | | | 3 | | | 38,450,000 |
La Mesa Vesta Park | | | Tijuana | | | 810,013 | | | 75,253 | | | 2.2 | | | 1,178,598 | | | 2.1 | | | 2005 | | | 16 | | | 63,180,000 |
Nordika | | | Tijuana | | | 155,818 | | | 14,476 | | | 0.4 | | | 634,229 | | | 1.1 | | | 2007 | | | 1 | | | 17,150,000 |
El potrero | | | Tijuana | | | 282,771 | | | 26,270 | | | 0.8 | | | 381,977 | | | 0.7 | | | 2012 | | | 2 | | | 29,800,000 |
Vesta Park Tijuana III | | | Tijuana | | | 620,547 | | | 57,651 | | | 1.7 | | | 1,080,060 | | | 1.9 | | | 2014 | | | 3 | | | 55,640,000 |
Vesta Park Pacifico | | | Tijuana | | | 379,882 | | | 35,292 | | | 1.0 | | | 897,027 | | | 1.6 | | | 2017 | | | 2 | | | 30,700,000 |
VP Lago Este | | | Tijuana | | | 552,452 | | | 51,324 | | | 1.5 | | | 1,182,647 | | | 2.1 | | | 2018 | | | 2 | | | 71,100,000 |
Vesta Park Megaregion | | | Tijuana | | | 1,512,001 | | | 140,469 | | | 4.1 | | | 604,826 | | | 1.1 | | | 2022 | | | 7 | | | 150,070,000 |
VPT I | | | Tlaxcala | | | 680,616 | | | 63,231 | | | 1.8 | | | 1,030,341 | | | 1.8 | | | 2015 | | | 4 | | | 43,400,000 |
Exportec | | | Toluca | | | 220,122 | | | 20,450 | | | 0.6 | | | 278,679 | | | 0.5 | | | 1998 | | | 3 | | | 14,950,000 |
T 2000 | | | Toluca | | | 1,070,180 | | | 99,423 | | | 2.9 | | | 1,585,184 | | | 2.8 | | | 1998 | | | 3 | | | 83,810,000 |
El Coecillo Vesta Park | | | Toluca | | | 816,056 | | | 75,814 | | | 2.2 | | | 1,326,063 | | | 2.4 | | | 2007 | | | 1 | | | 57,130,000 |
Vesta Park Toluca I | | | Toluca | | | 1,000,161 | | | 92,918 | | | 2.7 | | | 1,553,202 | | | 2.8 | | | 2006 | | | 5 | | | 76,420,000 |
Vesta Park Toluca II | | | Toluca | | | 1,474,297 | | | 136,967 | | | 4.0 | | | 2,036,412 | | | 3.6 | | | 2014 | | | 6 | | | 111,800,000 |
Vesta Park Apodaca | | | Monterrey | | | 1,023,145 | | | 95,053 | | | 2.8 | | | — | | | 0.0 | | | 2023 | | | 4 | | | 76,270,000 |
Vesta Park Juarez Oriente | | | Cd Juarez | | | 529,389 | | | 49,182 | | | 1.4 | | | — | | | 0.0 | | | 2023 | | | 2 | | | 41,000,000 |
Other | | | | | 5,970,498 | | | 554,679 | | | 16.2 | | | 9,609,961 | | | 17.0 | | | na | | | 45 | | | 504,980,000 | |
| | Total | | | 36,905,960 | | | 3,428,676 | | | 100.0 | | | 51,613,071 | | | 91.5 | | | | | 213 | | | 2,800,770,000 | ||
| | Other income (reimbursements)(2) | | | 4,786,959 | | | 8.5 | | | | | | | |||||||||||||
| | Total | | | 56,400,030 | | | 100.0 | | | Vesta Offices at the DSP Park(3) | | | 300,000 | |||||||||||||
| | | | | | | | | | | | | | Under construction | | | 300,620,000 | ||||||||||
| | | | | | | | | | | | | | Total | | | 3,101,690,000 | ||||||||||
| | | | | | | | | | | | | | Land improvements | | | 13,794,975 | ||||||||||
| | | | | | | | | | | | | | Land Reserves | | | 140,100,000 | ||||||||||
| | | | | | | | | | | | | | Costs to Complete Construction in Process | | | -142,781,071 | ||||||||||
| | | | | | | | | | | | | | Appraisal Total | | | 3,112,803,904 |
(1) | Other income (reimbursements) includes: (i) the reimbursement of payments made by us on behalf of some of our tenants to cover maintenance fees and other services, which we incur under the respective lease contracts; and (ii) management fees arising from the real estate portfolio we sold in May 2019. |
(2) | Refers to the appraisal value of our corporate offices located at the Douki Seisan Park. |
State | | | Number of Properties | | | Number of Leases | | | GLA | | | GLA | | | Share of Total GLA | | | Rental Income | | | Share of Total Rental Income |
| | | | | | (square feet) | | | (square meters) | | | (%) | | | (millions of US$) | | | (%) | |||
Baja California | | | 60 | | | 86 | | | 6,890,292 | | | 640,129 | | | 18.7 | | | 9,785,271 | | | 17.3 |
Querétaro | | | 39 | | | 54 | | | 6,142,001 | | | 570,611 | | | 16.7 | | | 8,265,771 | | | 14.7 |
Estado de México | | | 20 | | | 33 | | | 4,767,933 | | | 442,955 | | | 12.9 | | | 7,610,336 | | | 13.5 |
Guanajuato | | | 21 | | | 43 | | | 3,577,242 | | | 332,337 | | | 9.7 | | | 4,401,904 | | | 7.8 |
Jalisco | | | 9 | | | 13 | | | 3,608,235 | | | 335,216 | | | 9.8 | | | 5,654,236 | | | 10.0 |
Chihuahua | | | 18 | | | 27 | | | 3,323,565 | | | 308,769 | | | 9.0 | | | 4,541,579 | | | 8.1 |
Aguascalientes | | | 10 | | | 25 | | | 2,450,066 | | | 227,619 | | | 6.6 | | | 3,566,537 | | | 6.3 |
San Luis Potosí | | | 12 | | | 14 | | | 1,564,349 | | | 145,333 | | | 4.2 | | | 1,999,256 | | | 3.5 |
Nuevo Leon | | | 6 | | | 8 | | | 1,521,074 | | | 141,312 | | | 4.1 | | | 1,350,665 | | | 2.4 |
Other states | | | 18 | | | 33 | | | 3,061,203 | | | 284,395 | | | 8.3 | | | 4,437,516 | | | 7.9 |
Other revenues(1) | | | | | | | | | | | | | 4,786,959 | | | 8.5 | |||||
Total | | | 213 | | | 336 | | | 36,905,960 | | | 3,428,676 | | | 100.0 | | | 56,400,030 | | | 100.0 |
(1) | Other revenues refer to maintenance and other costs and expenses incurred by us on behalf our tenants, which are subject to reimbursement by the tenants in accordance with their leases. |
Location | | | Total Land Reserves | | | Total Land Reserves | | | Percentage of Total Land Reserves | | | Appraisal Value as of September 30, 2023(1) | | | Estimated GLA to be Developed | | | Estimated GLA to be Developed |
| | (Hectares) | | | (Acres) | | | (%) | | | (thousands of US$) | | | (square meters) | | | (square feet) | |
Aguascalientes | | | 116.5 | | | 288.0 | | | 39.2 | | | 31,500 | | | 524,407 | | | 5,644,668 |
Querétaro | | | 48.0 | | | 118.5 | | | 16.1 | | | 31,880 | | | 215,874 | | | 2,323,652 |
Monterrey | | | 40.8 | | | 100.8 | | | 13.7 | | | 32,660 | | | 183,626 | | | 1,976,528 |
San Miguel Allende | | | 36.0 | | | 88.8 | | | 12.1 | | | 15,530 | | | 161,800 | | | 1,741,605 |
San Luis Potosí | | | 23.7 | | | 58.7 | | | 8.0 | | | 10,020 | | | 106,844 | | | 1,150,061 |
Guanajuato | | | 31.6 | | | 78.2 | | | 10.6 | | | 17,720 | | | 142,350 | | | 1,532,241 |
México | | | 0 | | | 0 | | | 0 | | | 0 | | | 0 | | | 0 |
Ciudad Juárez | | | 0 | | | 0 | | | 0 | | | 0 | | | 0 | | | 0 |
Guadalajara | | | 0 | | | 0 | | | 0 | | | 0 | | | 0 | | | 0 |
Tijuana | | | 0 | | | 0 | | | 0 | | | 0 | | | 0 | | | 0 |
Puebla | | | 0.9 | | | 2.1 | | | 0.3 | | | 790 | | | 3,869 | | | 41,647 |
Total | | | 297.5 | | | 735.1 | | | 100.0 | | | 140,100.0 | | | 1,338,770.0 | | | 14,410,402.0 |
(1) | Land value is appraised at cost. For more information, see “Presentation of Financial and Certain Other Information—Appraisals.” |
Client | | | Country | | | Share of Total GLA | | | Share of Total Rental Income | | | Remaining Lease Term |
| | | | (%) | | | (%) | | | (years) | ||
Nestlé | | | Switzerland | | | 4.9 | | | 5.4 | | | 6.8 |
TPI | | | United States | | | 3.3 | | | 4.5 | | | 4.4 |
Grupo Safran | | | France | | | 3.3 | | | 4.3 | | | 5.8 |
Nissan | | | Japan | | | 2.7 | | | 2.7 | | | 1.0 |
Mercado Libre | | | Argentina | | | 2.5 | | | 3.0 | | | 7.9 |
Bombardier Aerospace | | | Canada | | | 1.8 | | | 2.2 | | | 12.2 |
Foxconn | | | Taiwan | | | 1.8 | | | 1.8 | | | 6.5 |
Continental | | | Germany | | | 1.7 | | | 1.5 | | | 7.9 |
Coppel | | | Mexico | | | 1.7 | | | 1.5 | | | 8.0 |
Gates | | | United States | | | 1.6 | | | 1.7 | | | 7.9 |
Industry | | | As of September 30, 2023 |
| | (%) | |
Automotive | | | 33.0 |
Logistics | | | 12.4 |
Food and beverage | | | 9.3 |
Aerospace | | | 6.9 |
E-commerce | | | 7.0 |
Plastics | | | 2.4 |
Recreational vehicles | | | 3.9 |
Medical devices | | | 1.9 |
Renewable energy | | | 3.6 |
Other industries(1) | | | 19.6 |
(1) | Includes various manufacturing industries, such as electronics, household appliances and metal industries. |
Industry | | | Rental Income | | | Share of Total Rental Income |
| | (millions of US$) | | | (%) | |
Automotive | | | 14.5 | | | 25.7 |
Logistics | | | 8.8 | | | 15.6 |
Aerospace | | | 3.8 | | | 6.7 |
Food and beverage | | | 3.9 | | | 7.0 |
Renewable energy | | | 2.3 | | | 4.2 |
Recreational vehicles | | | 0.7 | | | 1.1 |
E-commerce | | | 3.9 | | | 6.9 |
Plastics | | | 1.5 | | | 2.7 |
Medical devices | | | 1.0 | | | 1.8 |
Paper | | | 0.1 | | | 0.1 |
Other industries(1) | | | 8.6 | | | 15.2 |
Other revenues(2) | | | 7.3 | | | 13.0 |
Total | | | 56.4 | | | 100.0 |
(1) | Includes various manufacturing industries, such as electronics, household appliances, renewable energy, metal and paper industries. |
(2) | Other revenues refer to maintenance and other costs and expenses incurred by us on behalf our tenants, which are subject to reimbursement by the tenants in accordance with their leases. |
| | As of September 30, | | | As of December 31, | ||||||||||||||||
| | 2023 | | | 2022 | | | 2022 | | | 2021 | | | 2020 | | | 2019 | | | 2018 | |
Occupancy rate | | | 97.3% | | | 96.6% | | | 97.3% | | | 94.3% | | | 91.1% | | | 94.7% | | | 97.2% |
| | As of September 30, | | | As of December 31, | |||||||
| | 2023 | | | 2022 | | | 2022 | | | 2021 | |
Region | | | | | | | | | ||||
Northeast | | | 100.0% | | | 100.0% | | | 93.2% | | | 100.0% |
Northwest | | | 100.0% | | | 100.0% | | | 100.0% | | | 97.1% |
Central | | | 97.2% | | | 99.0% | | | 99.1% | | | 95.1% |
Bajío North | | | 97.5% | | | 86.3% | | | 93.3% | | | 82.9% |
Bajío South | | | 93.7% | | | 95.7% | | | 92.6% | | | 94.6% |
Total | | | 97.3% | | | 96.6% | | | 97.3% | | | 94.3% |
• | failure by the tenant to comply with its payment obligations under the lease; |
• | if the tenant assigns or subleases the premises without our prior written consent; |
• | if the tenant carries out any construction work in, or modification of, the premises, except as permitted under the lease; |
• | if the tenant uses the premises in a manner other than that permitted by the lease; |
• | failure by the tenant to comply with any of the provisions of the internal regulations of the industrial park where the leased premises are located; |
• | if the tenant obstructs, or in any other manner impedes, access to the persons designated by us to inspect the premises; |
• | if the tenant breaches any other obligation under the lease agreement and such breach remains uncured for more than 30 days; |
• | if the tenant is subject to any strike or similar labor procedure during more than 60 days and such labor strike causes the tenant to breach its obligations under the lease; |
• | if any lien is created over the premises or any portion thereof, or if any claim derived from any work or installation carried out by the tenant or in its name is filed; and |
• | if during the term of the lease the tenant or its guarantor enters bankruptcy or reorganization proceedings and the tenant fails to provide a substitute guarantee. |
| | Number of Expiring Leases | | | Expiring Leased GLA | | | Expiring Leased GLA | | | Share of Total GLA | |
| | | | (square feet) | | | (square meters) | | | (%) | ||
Year | | | | | | | | | ||||
2023 | | | 9 | | | 811,639 | | | 75,404 | | | 2% |
2024 | | | 51 | | | 4,127,929 | | | 383,497 | | | 12% |
2025 | | | 49 | | | 3,728,878 | | | 346,424 | | | 11% |
2026 | | | 61 | | | 4,628,095 | | | 429,964 | | | 14% |
2027 and thereafter | | | 166 | | | 20,832,390 | | | 1,935,392 | | | 61% |
Total | | | 336 | | | 34,128,931 | | | 3,170,682 | | | 100.0% |
• | plans and specifications; |
• | environmental, geological and soil reports, including geotechnical reports, environmental site assessments, property condition assessments and Alta surveys prepared by third parties upon our request; |
• | evidence of marketable title, existing liens, and customary insurance policies (if any), in addition to any title searches conducted by third parties upon our request; |
• | all licenses and permits; |
• | financial and credit information relating to the property and its tenants; and |
• | existing leases, tenant rent collections, operating expenses, real estate taxes, leasing and renewal activity. |
• | economic dynamics and the tax and regulatory environment of the area; |
• | regional, market and property specific supply/demand dynamics; |
• | market rents and potential for rent growth; |
• | population density and growth potential; |
• | existence or proximity to industrial parks or other areas with convenient access to major transportation arteries and ports; |
• | existence of industrial clusters or geographic areas where our existing clients have or are planning to have operations; |
• | existing and potential competition from other property owners and operators; |
• | barriers to entry and other property-specific sources of sustainable competitive advantage; |
• | quality of construction, design, and current physical condition of the asset; |
• | opportunity to increase the property’s operating performance and value through better management, focused leasing efforts and/or capital improvements; |
• | population income trends; and |
• | location, visibility and accessibility of the property. |
• | Governance. Our top priorities in this area include (i) implementing our governance responsibility guidelines, (ii) increasing the ESG standards of our suppliers, (iii) promoting diversity within our group, and (iv) implementing a risk management culture. We plan to use the following KPIs to measure our performance toward achieving these goals by 2025: |
• | Governance Responsibility Guidelines. We intend for all of our investment decisions to be made under responsible investment guidelines, including the UN PRI. |
• | Supplier ESG Commitments. We are focused on having 35% of our total suppliers, including our main suppliers, commit to following our ESG supplier requirements. Since 2020, we have conducted inspections over our most important suppliers to ensure their compliance with our ESG requirements. With this process, we intend that our supply chain complies with the requirements of our ESG Strategy. |
• | Diversity. We are committed to having three female members of our Board of Directors by the end of 2025. As of the date of this prospectus, our Board of Directors has two female members. |
• | Risk Management. We have created different matrixes to follow up on our risk management goals. In 2021, we implemented a climate change and resilience matrix, which resulted in the implementation of a physical risk property level matrix in 2022. In addition, during 2022, we developed a human rights due diligence matrix, which considers all of our stakeholders. |
• | Social. Our main priorities in this field are to (i) continue expanding our social investing programs with local communities in the areas where we operate, (ii) strengthen the ESG capabilities of our personnel and tenants, and (iii) ensure we follow best practices in transparency relating to human rights, diversity and equal right opportunities. We plan to use the following KPIs to measure our performance toward achieving these goals by 2025: |
• | Social Investing Programs. We are focused on creating strategic alliances with local communities to increase their involvement in ESG projects. In 2022, we achieved the objective of this KPI by creating ESG strategic alliance projects equal to US$1.5 million. To achieve this KPI, we created strategic alliances with different stakeholders. As a result, our projects have more resources, and we are able to have broader impact on local communities, expand the scope of our projects and cover part of their expenses. Due to the number of alliances we have created in the past three years and the amount raised by events, such as our cycling race, we achieved our objective earlier than anticipated. Accordingly, we will set new short and mid-term goals in the near future to continue contributing to local communities. |
• | Personnel and Tenants. We continuously seek to strengthen the ESG capabilities of our personnel and tenants by providing ESG training to our personnel and exposure of ESG topics to our tenants. As of December 31, 2022, all of our personnel had received ESG training, and all of our tenants had been sensitized on ESG topics. We provide our tenants with our ESG guidelines each year. In addition, twice a year, we hold an industrial park’s assembly alongside tenants, where our ESG department discusses best ESG practices and reiterates the importance of environmental data collection. We measure our KPI towards achieving our goal by the number of tenants actively participating in our data collection effort. |
• | Gender Gaps. We are striving to reduce the gender salary gap at all levels of the Company with a focus on the management level. Our goal is to reduce the gap by 15% by 2025. |
• | Environmental. Our principal environmental goals are to (i) reduce the environmental impact of our operations, (ii) improve the efficiency of our portfolio by obtaining green certifications, and (iii) implement resilient climate change actions. |
• | Environmental Impact. We are focused on reducing our carbon footprint and water consumption by 20.0%, while increasing the amount of waste we recycle or reuse by 50.0%. |
• | Green Certifications. We intend that 19% of our GLA receives a green certification, such as LEED, BOMA and EDGE. |
• | Environmental Risk Management. We are in a continuous process of identifying all physical and transitional risks in connection with our operations to define any mitigation and prevention actions. We are committed to complying with the Paris Agreement in recognition of the threats posed by climate change. Following the recommendations of the Task Force on Climate-Related Financial Disclosures, we have analyzed potential risks and opportunities together with our climate-related financial information. In addition, we have designed a matrix of transitional, physical and social risks having potential impacts on each department of the Company. This matrix will allow us to lay the foundations for our resilience and climate change mitigation and preventive actions. |
| | As of September 30, | | | As of December 31, | ||||
Region | | | 2023 | | | 2022 | | | 2021 |
Bajío North | | | 5 | | | 5 | | | 6 |
Bajío South | | | 14 | | | 13 | | | 12 |
Central | | | 7 | | | 7 | | | 8 |
Corporate | | | 54 | | | 49 | | | 49 |
Northeast | | | 5 | | | 4 | | | 4 |
Northwest | | | 8 | | | 9 | | | 11 |
Total / Average | | | 93 | | | 87 | | | 90 |
Director | | | Age | | | First elected | | | Alternate | | | Age | | | First elected |
Lorenzo Manuel Berho Corona (Chairman of the Board) | | | 64 | | | 2001 | | | Lorenzo Dominique Berho Carranza | | | 41 | | | 2001 |
Stephen B. Williams* | | | 73 | | | 2001 | | | Jorge Alberto de Jesús Delgado Herrera* | | | 77 | | | 2011 |
José Manuel Domínguez Díaz Ceballos* | | | 64 | | | 2015 | | | José Guillermo Zozaya Délano* | | | 71 | | | 2020 |
Craig Wieland* | | | 64 | | | 2016 | | | Enrique Carlos Lorente Ludlow* | | | 57 | | | 2007 |
Luis Javier Solloa Hernández* | | | 57 | | | 2015 | | | Viviana Belaunzarán Barrera* | | | 52 | | | 2020 |
Loreanne Helena García Ottati* | | | 42 | | | 2022 | | | José Antonio Pujals Fuentes* | | | 86 | | | 2001 |
Oscar Francisco Cázares Elías* | | | 64 | | | 2014 | | | Rocío Ruiz Chávez * | | | 80 | | | 2019 |
Daniela Berho Carranza | | | 39 | | | 2014 | | | Elías Laniado Laborín* | | | 73 | | | 2021 |
Douglas M. Arthur* | | | 43 | | | 2021 | | | Manuela Molina Peralta* | | | 51 | | | 2023 |
Luis de la Calle Pardo* | | | 64 | | | 2011 | | | Francisco Javier Mancera de Arrigunaga* | | | 64 | | | 2011 |
* | Independent within the meaning of the Mexican Securities Market Law and applicable SEC rules. |
• | our general strategy; |
• | the creation of any committees, other than the Audit Committee and the Corporate Practices Committee; |
• | the guidelines for the use of our corporate assets and those of the companies we control; |
• | any transaction with a related party, except in limited circumstances (as described in “Related Party Transactions”); |
• | any unusual or nonrecurring transaction, or any transaction involving the acquisition or sale of assets, the creation of liens, the granting of guaranties or the assumption of liabilities representing 5.0% or more of our consolidated assets during any fiscal year; |
• | the appointment, removal and compensation of our Chief Executive Officer; |
• | a waiver with respect to any board members that wish to take advantage of any corporate opportunities; |
• | our accounting and internal control policies; |
• | our accounting policies, in light of applicable accounting policies; |
• | the selection of our external auditors; |
• | our compensation policy for members of our committees and senior management; |
• | our policies for the disclosure of information; and |
• | the opinion that will be submitted for approval at our annual shareholders’ meeting with respect to the report of our Chief Executive Officer (which includes our audited consolidated financial statements) and the report on the accounting policies and criteria used in the preparation of our financial statements. |
• | identify and supervise the risks to which we and our operations are subject; |
• | order the Chief Executive Officer to disclose material non-public information; |
• | approve policies relating to the acquisition and disposition of our common shares; |
• | appoint, when necessary, provisional members of our Board of Directors; and |
• | determine the applicable actions to correct irregularities, and implement the appropriate corrective measures. |
• | requesting and obtaining information about us and our subsidiaries that is necessary to participate in discussions and making decisions; |
• | requesting the attendance of officers and external auditors where their attendance may contribute or be informative to decision-making at meetings; |
• | requesting and obtaining information from third-party experts; |
• | attending board meetings; |
• | disclosing material information in possession of directors; |
• | postpone meetings of our Board of Directors for up to three calendar days when any board member has not been called or has not been timely called or, as applicable, was not provided with information given to the other board members; and |
• | discuss and vote, exclusively when solely members and the secretary are present. |
Name | | | Title |
Luis Javier Solloa Hernández | | | Chairman |
Stephen B. Williams | | | Member |
José Manuel Domínguez Díaz Ceballos | | | Member |
Viviana Belaunzarán Barrera | | | Member |
• | providing an opinion to our Board of Directors with respect to the report by our Chief Executive Officer on the adequacy and sufficiency of the policies and criteria followed in connection with the preparation of our financial information; |
• | requesting information from our Chief Executive Officer and other employees with respect to the preparation of our financial information; |
• | requesting the opinion of independent experts where necessary or advisable; |
• | investigating violations to our operating guidelines and policies and record-keeping processes; and |
• | reporting any material issues to our Board of Directors. |
Name | | | Title |
Francisco Javier Mancera de Arrigunaga | | | Chairman |
José Antonio Pujals Fuentes | | | Member |
José Guillermo Zozaya Délano | | | Member |
Oscar Francisco Cázares Elías | | | Member |
• | providing an opinion to our Board of Directors with respect to the financial information submitted by our Chief Executive Officer; |
• | assisting our Board of Directors in the preparation of reports to our shareholders for submission at the annual shareholders’ meeting; |
• | reviewing, recommending and reporting on the execution of related party transactions; |
• | acting as nominating committee and recommending individuals for appointment to our Board of Directors and committees and to executive positions; |
• | providing opinions to our Board of Directors in connection with the performance of our executive officers and their compensation; |
• | providing opinions regarding permitting our directors and executive officers to take advantage of corporate opportunities; |
• | requesting the opinion of independent experts where necessary or advisable; and |
• | calling shareholders’ meetings. |
Name | | | Title |
Douglas M. Arthur | | | Chairman |
Lorenzo Manuel Berho Corona | | | Member |
Stephen B. Williams | | | Member |
Craig Wieland | | | Member |
Manuela Molina Peralta | | | Member |
Name | | | Title |
José Antonio Pujals Fuentes | | | Chairman |
Elías Laniado Laborín | | | Member |
Alejandro Pucheu Romero | | | Member |
Alfredo Paredes Calderón | | | Member |
Daniela Berho Carranza | | | Member |
Name | | | Title |
Jorge Alberto de Jesús Delgado Herrera | | | Chairman |
José Manuel Domínguez Díaz Ceballos | | | Member |
Daniela Berho Carranza | | | Member |
Lorenzo Manuel Berho Corona | | | Member |
Loreanne Helena García Ottati | | | Member |
Name | | | Title |
José Manuel Domínguez Díaz Ceballos | | | Chairman |
Manuela Molina Peralta | | | Member |
Stephen B. Williams | | | Member |
Lorenzo Manuel Berho Corona | | | Member |
Name | | | Position | | | Age | | | First appointed |
Lorenzo Dominique Berho Carranza | | | Chief Executive Officer | | | 41 | | | 2018 |
Juan Felipe Sottil Achutegui | | | Chief Financial Officer | | | 64 | | | 2009 |
Guillermo Díaz Cupido | | | Chief Investment Officer | | | 70 | | | 2016 |
Diego Berho Carranza | | | Chief Portfolio Officer | | | 36 | | | 2018 |
Alfredo Marcos Paredes Calderón | | | Chief Human Resources and Integrity Officer | | | 50 | | | 2016 |
Alejandro Pucheu Romero | | | General Counsel | | | 49 | | | 2007 |
Francisco Eduardo Estrada Gómez Pezuela | | | Executive Regional Vice President – Bajío and Central Region | | | 59 | | | 1998 |
Mario Humberto Chacón Gutiérrez | | | Executive Regional Vice President – North Region | | | 42 | | | 2021 |
Rodrigo Cueto Bosch | | | Senior Vice President, Strategic Transactions | | | 45 | | | 2021 |
Juan Carlos Cueto Riestra | | | Vice President, New Business – Central Region | | | 44 | | | 2019 |
Adriana Eguía Alaniz | | | Vice President, New Business – Baja California | | | 41 | | | 2019 |
Mario Adalberto Ortega Chávez | | | Vice President, New Business – Aguascalientes | | | 62 | | | 2016 |
Alejandro Rafael Muñoz Pedrajo | | | Vice President, New Business – Silao | | | 47 | | | 2016 |
Teodoro Hugo Díaz Estrada | | | Vice President, Asset and Property Management | | | 47 | | | 2020 |
Carlos Alberto Aranda Hernández | | | Vice President, Development and Capital Projects | | | 45 | | | 2020 |
Laura Elena Ramírez Zamorano Barrón | | | ESG Director | | | 40 | | | 2020 |
María Fernanda Bettinger Davó | | | Director of Investor Relations | | | 31 | | | 2020 |
• | the majority independent director requirement under Section 303A.01 of the NYSE listing rules—as allowed by the laws of Mexico, independent directors need only comprise 25% of our Board of Directors; |
• | the requirement under Section 303A.07 of the NYSE listing rules that an audit committee compensation operate pursuant to a charter that satisfies certain requirements—as allowed by the laws of Mexico, our audit committee does not operate pursuant to a written charter; |
• | the requirement under Section 303A.05 of the NYSE listing rules that a compensation committee composed solely of independent directors governed by a compensation committee charter oversee executive compensation—as allowed by the laws of Mexico, we do not have a compensation committee; |
• | the requirement under Section 303A.04 of the NYSE listing rules that director nominees be selected or recommended for selection by either a majority of the independent directors or a nominating committee composed solely of independent directors—as allowed by the laws of Mexico, we do not have a nominating committee nor are our director nominees selected by a majority of independent directors; |
• | the requirement under Section 303A.08 of the NYSE listing rules that a listed issuer obtain shareholder approval when it establishes or materially amends a share option or purchase plan or other arrangement pursuant to which shares may be acquired by officers, directors, employees or consultants; |
• | the requirement under Section 312.03 of the NYSE listing rules that a listed issuer obtain shareholder approval prior to issuing or selling securities (or securities convertible into or exercisable for common or ordinary shares) that equal 20.0% or more of the issuer’s outstanding common or ordinary shares or voting power prior to such issuance or sale; and |
• | the requirement under Section 303A.03 of the NYSE listing rules that the independent directors have regularly scheduled meetings with only the independent directors present—the laws of Mexico do not require that independent directors regularly have scheduled meetings at which only independent directors are present. |
• | each person, or group of affiliated persons, known by us to own beneficially 5% or more of each class of our outstanding common shares; and |
• | each of our directors and officers, individually. |
• | immediately prior to the completion of the offering: 836,274,798 common shares; and |
• | following the sale of common shares. |
| | Common Shares Beneficially Owned Prior to Offering | | | Common Shares Beneficially Owned After Offering | |||||||
| | Common Shares | | | % | | | Common Shares(1) | | | % | |
Shareholders | | | | | | | | | ||||
Named Directors and Officers: | | | | | | | | | ||||
Lorenzo Manuel Berho Corona | | | 24,220,584 | | | 2.90 | | | 24,220,584 | | | 2.76 |
Stephen B. Williams | | | * | | | * | | | * | | | * |
José Manuel Domínguez Díaz Ceballos | | | * | | | * | | | * | | | * |
Craig Wieland | | | — | | | — | | | — | | | — |
Luis Javier Solloa Hernández | | | — | | | — | | | — | | | — |
Loreanne Helena García Ottati | | | — | | | — | | | — | | | — |
Oscar Francisco Cázares Elías | | | — | | | — | | | — | | | — |
Daniela Berho Carranza | | | * | | | * | | | * | | | * |
Douglas M. Arthur | | | * | | | * | | | * | | | * |
Luis de la Calle Pardo | | | — | | | — | | | — | | | — |
Lorenzo Dominique Berho Carranza | | | * | | | * | | | * | | | * |
Jorge Alberto de Jesús Delgado Herrera | | | — | | | — | | | — | | | — |
José Guillermo Zozoya Delano | | | * | | | * | | | * | | | * |
Enrique Carlos Lorente Ludlow | | | — | | | — | | | — | | | — |
Viviana Belaunzarán Barrera | | | — | | | — | | | — | | | — |
José Antonio Pujals Fuentes | | | — | | | — | | | — | | | — |
Rocío Ruiz Chávez | | | — | | | — | | | — | | | — |
| | Common Shares Beneficially Owned Prior to Offering | | | Common Shares Beneficially Owned After Offering | |||||||
| | Common Shares | | | % | | | Common Shares(1) | | | % | |
Elías Laniado Laborín | | | — | | | — | | | — | | | — |
Manuela Molina Peralta | | | — | | | — | | | — | | | — |
Francisco Javier Mancera de Arrigunaga | | | — | | | — | | | — | | | — |
Juan Felipe Sottil Achutegui | | | * | | | * | | | * | | | * |
Guillermo Díaz Cupido | | | * | | | * | | | * | | | * |
Diego Berho Carranza | | | * | | | * | | | * | | | * |
Alfredo Marcos Paredes Calderón | | | * | | | * | | | * | | | * |
Alejandro Pucheu Romero | | | * | | | * | | | * | | | * |
Mario Humberto Chacón Gutiérrez | | | * | | | * | | | * | | | * |
Juan Carlos Cueto Riestra | | | * | | | * | | | * | | | * |
Francisco Eduardo Estrada Gómez Pezuela | | | * | | | * | | | * | | | * |
Adriana Eugenia Eguia Alaniz | | | * | | | * | | | * | | | * |
Mario Adalberto Ortega Chávez | | | * | | | * | | | * | | | * |
Alejandro Rafael Muñoz Pedrajo | | | * | | | * | | | * | | | * |
Laura Elena Ramírez Zamorano Barrón | | | * | | | * | | | * | | | * |
María Fernanda Bettinger Davó | | | * | | | * | | | * | | | * |
Teodoro Hugo Díaz Estrada | | | * | | | * | | | * | | | * |
Carlos Alberto Aranda Hernández | | | * | | | * | | | * | | | * |
Rodrigo Cueto Bosch | | | — | | | — | | | — | | | — |
Family Group:(2) | | | | | | | | | ||||
Lorenzo Manuel Berho Corona | | | 24,220,584 | | | 2.90 | | | 24,220,584 | | | 2.76 |
Lorenzo D. Berho Carranza | | | * | | | * | | | * | | | * |
Diego Berho Carranza | | | * | | | * | | | * | | | * |
Alejandro Berho Corona | | | * | | | * | | | * | | | * |
Guillermo Briones Perez | | | — | | | — | | | — | | | — |
Daniela Berho Carranza | | | * | | | * | | | * | | | * |
Carla Berho Carranza | | | * | | | * | | | * | | | * |
Paola Berho Corona | | | * | | | * | | | * | | | * |
Maria de Lourdes Corona Cuesta | | | * | | | * | | | * | | | * |
Other 5% Shareholders: | | | | | | | | | ||||
Afore Coppel, S.A de C.V.(3) | | | 55,548,760 | | | 6.6 | | | 55,548,760 | | | 6.34 |
GIC Private Limited(4) | | | 44,370,825 | | | 5.3 | | | 44,370,825 | | | 5.06 |
* | Represents beneficial ownership of less than one percent (1%) of the outstanding common shares. |
(1) | Includes common shares represented by ADSs. |
(2) | Refers to the group of individuals formed by Lorenzo Manuel Berho Corona’s family as of the date of this prospectus. |
(3) | As of the date of this prospectus, Afore Coppel S.A de C.V. is the beneficial owner of 6.6%, or 55,548,760, of our common shares. The principal business address of Afore Coppel S.A de C.V. is Av. Insurgentes No. 553, Piso 6, Col. Escandón, Delegación Miguel Hidalgo, C.P. 11800, Mexico City, Mexico. |
(4) | Based on Schedule 13G filed by GIC Private Limited on July 10, 2023, GIC Private Limited is the beneficial owner of 5.3%, or 44,370,825, of our common shares. The principal business address of GIC Private Limited is 168 Robinson Road, #37-01 Capital Tower, Singapore 068912. |
• | Promote, incorporate, organize, exploit, acquire and participate in, as well as to dispose of, the capital stock or estate of all kind of companies, joint-ventures, trusts, associations or enterprises, of any nature, having or not legal personality, both Mexican and foreign, as well to participate in their management, dissolution or liquidation. |
• | Acquire or dispose, and carry out any actions, with respect to any legal rights under any legal title, with respect to shares, interests, partnership interests, equity interest, bonds, obligations, credit instruments, certificates (of any kind), equity interests and any kind of interests, irrespective of their denomination and being subject to the laws of any jurisdiction, of any kind of companies, joint-ventures, trusts, associations or enterprises, of any nature, having or not legal personality, both Mexican and foreign, whether at their incorporation or by subsequent purchase, as well as sell, dispose of and negotiate such shares, interests partnership interests, equity interests or other interests, including any other securities. |
• | Acquire or dispose of and any other actions related to real estate properties of any nature, as well as the lease of all kinds of real estate properties in any market, or to acquire or dispose of the rights to receive any income from leasing those real estate properties. |
• | Buy, sell, use, dispose, mortgage, use as collateral in any manner, exchange, lease, sublease, possess, transmit, give or receive possession, and in general, exploit any kind of land, office, buildings, storages |
• | the extension of our duration; |
• | our voluntary dissolution; |
• | any increase or decrease in the fixed portion of our capital stock; |
• | any change in our corporate purpose; |
• | a change of our nationality; |
• | our transformation into another type of corporate entity; |
• | our merger with any other corporate entity; |
• | any issuance of common shares with any special privileges or preferences; |
• | any redemption of common shares; |
• | any amendments to our bylaws; |
• | any other matter requiring approval at such a meeting in accordance with Mexican law or our bylaws; |
• | the cancellation of the registration of our common shares at the RNV or at any stock exchange; or |
• | any issuance of treasury shares for future sale in connection with a public offering. |
Calendar Months | | | Total Number of Common Shares Purchased(1) | | | Average Price Paid per Common Share (pesos) | | | Total Number of Common Shares Purchased as Part of Publicly Announced Plans or Programs(2) | | | U.S. Dollar Value of Units that May Yet Be Purchased Under the Plans or Programs(2)(3) |
January 2022 | | | — | | | — | | | — | | | 100,000,000 |
February 2022 | | | 100,000 | | | 36.5 | | | 100,000 | | | 99,823,365 |
March 2022 | | | 3,293,272 | | | 36.9 | | | 3,293,272 | | | 93,937,749 |
April 2022 | | | 260,234 | | | 36.8 | | | 260,234 | | | 93,468,528 |
May 2022 | | | 2,104,163 | | | 36.8 | | | 2,104,163 | | | 89,757,521 |
June 2022 | | | 2,891,577 | | | 36.5 | | | 2,891,577 | | | 84,566,688 |
Calendar Months | | | Total Number of Common Shares Purchased(1) | | | Average Price Paid per Common Share (pesos) | | | Total Number of Common Shares Purchased as Part of Publicly Announced Plans or Programs(2) | | | U.S. Dollar Value of Units that May Yet Be Purchased Under the Plans or Programs(2)(3) |
July 2022 | | | — | | | — | | | — | | | 84,566,688 |
August 2022 | | | — | | | — | | | — | | | 84,566,688 |
September 2022 | | | 61,752 | | | 37.0 | | | 61,752 | | | 84,452,951 |
October 2022 | | | — | | | — | | | — | | | 84,452,951 |
November 2022 | | | — | | | — | | | — | | | 84,452,951 |
December 2022 | | | — | | | — | | | — | | | 84,452,951 |
January 2023 | | | — | | | — | | | — | | | — |
February 2023 | | | — | | | — | | | — | | | — |
March 2023 | | | — | | | — | | | — | | | — |
April 2023 | | | — | | | — | | | — | | | — |
May 2023 | | | — | | | — | | | — | | | — |
June 2023 | | | — | | | — | | | — | | | — |
July 2023 | | | — | | | — | | | — | | | — |
August 2023 | | | — | | | — | | | — | | | — |
September 2023 | | | — | | | — | | | — | | | — |
Total | | | 8,653,988 | | | 36.7 | | | 8,653,988 | | | 84,452,951 |
(1) | In the year ended December 31, 2022 and in the nine-month period ended September 30, 2023, no common shares were purchased other than through a publicly announced plan or program by us. |
(2) | The number entered in the “Total” row of the column “U.S. Dollar Value of units that May Yet Be Purchased Under the Plans or Programs” refers to the U.S. dollar value of the common shares which may be repurchased in the periods as approved by our Board of Directors. |
(3) | Our subsidiaries and other entities controlled by us are prohibited from purchasing, directly or indirectly, any of our common shares or any shares in any other company or entity which is a shareholder at our Company. |
• | holders of 5.0% or more of our outstanding common shares to bring civil liability action against one or more of our directors (for the benefit of the Company and not for the plaintiff, as a derivative suit), for any damages or losses suffered by our Company as a result of a breach of the directors’ duty of loyalty or duty of care. The statute of limitations for this type of action expires in five years. |
• | holders of at least 10.0% of our outstanding share capital to: |
• | request that a shareholders’ meeting be called, |
• | request the deferral of any decision on a matter with respect to which they have not been sufficiently informed, and |
• | appoint one member of our Board of Directors and an alternate; and |
• | holders of 20.0% of our outstanding voting common shares to challenge any action taken at a shareholders’ meeting and seek an court injunction to prevent its execution, provided that (i) the action was taken in violation of Mexican law or our bylaws, (ii) the plaintiff did not attend the meeting or voted against the action, and (iii) the complaint is filed within 15 days from the adjournment of the meeting at which the action was taken and the plaintiff has posted guaranty in respect of any damage we may suffer as a result of the suspension of the execution of the action if the court ultimately rules against the plaintiff. These provisions have seldom been invoked in Mexico and, accordingly, there can be no certainty as to the manner in which the relevant court would address the complaint. |
• | any action between us and our shareholders; and |
• | any action between two or more shareholders or groups of shareholders regarding any matters relating to us. |
• | prior to the date of the transaction in which the shareholder became an interested shareholder, the Board of Directors of the corporation approves either the business combination or the transaction that resulted in the shareholder becoming an interested shareholder; |
• | upon consummation of the transaction that resulted in the shareholder becoming an interested shareholder, the interested shareholder owns at least 84% of the voting stock of the corporation, excluding common shares held by directors, officers, and employee stock plans; or |
• | at or after the date of the transaction in which the shareholder became an interested shareholder, the business combination is approved by the Board of Directors and authorized at a shareholders’ meeting by at least 66.6% of the voting stock which is not owned by the interested shareholder. |
• | We do not timely request that the rights be distributed to you or we request that the rights not be distributed to you; or |
• | We fail to deliver satisfactory documents to the depositary bank; or |
• | It is not reasonably practicable to distribute the rights. |
• | We do not request that the property be distributed to you or if we request that the property not be distributed to you; or |
• | We do not deliver satisfactory documents to the depositary bank; or |
• | The depositary bank determines that all or a portion of the distribution to you is not reasonably practicable. |
• | The common shares are duly authorized, validly issued, fully paid, non-assessable and legally obtained. |
• | All preemptive (and similar) rights, if any, with respect to such common shares have been validly waived or exercised. |
• | You are duly authorized to deposit the common shares. |
• | The common shares presented for deposit are free and clear of any lien, encumbrance, security interest, charge, mortgage or adverse claim, and are not, and the ADSs issuable upon such deposit will not be, “restricted securities” (as defined in the deposit agreement). |
• | The common shares presented for deposit have not been stripped of any rights or entitlements. |
• | ensure that the surrendered ADR is properly endorsed or otherwise in proper form for transfer; |
• | provide such proof of identity and genuineness of signatures as the depositary bank deems appropriate; |
• | provide any transfer stamps required by the State of New York or the United States; and |
• | pay all applicable fees, charges, expenses, taxes and other government charges payable by ADR holders pursuant to the terms of the deposit agreement, upon the transfer of ADRs. |
• | Temporary delays that may arise because (i) the transfer books for the common shares or ADSs are closed, or (ii) common shares are immobilized on account of a shareholders’ meeting or a payment of dividends. |
• | Obligations to pay fees, taxes and similar charges. |
• | Restrictions imposed because of laws or regulations applicable to ADSs or the withdrawal of securities on deposit. |
Fees: | | | Service: |
Up to U.S. 5¢ per ADS issued | | | Issuance of ADSs (e.g., an issuance of ADS upon a deposit of common shares, upon a change in the ADS(s)-to-common share ratio, or for any other reason), excluding ADS issuances as a result of distributions of common shares) |
| | ||
Up to U.S. 5¢ per ADS cancelled | | | Cancellation of ADSs (e.g., a cancellation of ADSs for delivery of deposited property, upon a change in the ADS(s)-to-common share ratio, or for any other reason) |
| | ||
Up to U.S. 5¢ per ADS held | | | Distribution of cash dividends or other cash distributions (e.g., upon a sale of rights and other entitlements) |
| |
Fees: | | | Service: |
| | Distribution of ADSs pursuant to (i) stock dividends or other free stock distributions, or (ii) exercise of rights to purchase additional ADSs | |
| | ||
| | Distribution of securities other than ADSs or rights to purchase additional ADSs (e.g., upon a spin-off) | |
| | ||
Up to U.S. 5¢ per ADS held on the applicable record date(s) established by the depositary bank | | | ADS Services |
| | ||
Up to U.S. 5¢ per ADS (or fraction thereof) transferred | | | Registration of ADS transfers (e.g., upon a registration of the transfer of registered ownership of ADSs, upon a transfer of ADSs into DTC and vice versa, or for any other reason) |
| | ||
Up to U.S. 5¢ per ADS (or fraction thereof) converted | | | Conversion of ADSs of one series for ADSs of another series (e.g., upon conversion of Partial Entitlement ADSs for Full Entitlement ADSs, or upon conversion of Restricted ADSs (each as defined in the Deposit Agreement) into freely transferable ADSs, and vice versa) |
• | taxes (including applicable interest and penalties) and other governmental charges; |
• | the registration fees as may from time to time be in effect for the registration of common shares on the share register and applicable to transfers of common shares to or from the name of the custodian, the depositary bank or any nominees upon the making of deposits and withdrawals, respectively; |
• | certain cable, telex and facsimile transmission and delivery expenses; |
• | the fees, expenses, spreads, taxes and other charges of the depositary bank and/or service providers (which may be a division, branch or affiliate of the depositary bank) in the conversion of foreign currency; |
• | the reasonable and customary out-of-pocket expenses incurred by the depositary bank in connection with compliance with exchange control regulations and other regulatory requirements applicable to common shares, ADSs and ADRs; and |
• | the fees, charges, costs and expenses incurred by the depositary bank, the custodian, or any nominee in connection with the ADR program. |
• | We and the depositary bank are obligated only to take the actions specifically stated in the deposit agreement without negligence or bad faith. |
• | The depositary bank disclaims any liability for any failure to carry out voting instructions, for any manner in which a vote is cast or for the effect of any vote, provided it acts in good faith and in accordance with the terms of the deposit agreement. |
• | The depositary bank disclaims any liability for any failure to determine the lawfulness or practicality of any action, for the content of any document forwarded to you on our behalf or for the accuracy of any translation of such a document, for the investment risks associated with investing in common shares, for the validity or worth of the common shares, for any tax consequences that result from the ownership of ADSs, for the credit-worthiness of any third party, for allowing any rights to lapse under the terms of the deposit agreement, for the timeliness of any of our notices or for our failure to give notice. |
• | We and the depositary bank will not be obligated to perform any act that is inconsistent with the terms of the deposit agreement. |
• | We and the depositary bank disclaim any liability if we or the depositary bank are prevented or forbidden from or subject to any civil or criminal penalty or restraint on account of, or delayed in, doing or performing any act or thing required by the terms of the deposit agreement, by reason of any provision, present or future of any law or regulation, or by reason of present or future provision of any provision of our By-laws, or any provision of or governing the securities on deposit, or by reason of any act of God or war or other circumstances beyond our control. |
• | We and the depositary bank disclaim any liability by reason of any exercise of, or failure to exercise, any discretion provided for in the deposit agreement or in our By-laws or in any provisions of or governing the securities on deposit. |
• | We and the depositary bank further disclaim any liability for any action or inaction in reliance on the advice or information received from legal counsel, accountants, any person presenting Shares for deposit, any holder of ADSs or authorized representatives thereof, or any other person believed by either of us in good faith to be competent to give such advice or information. |
• | We and the depositary bank also disclaim liability for the inability by a holder to benefit from any distribution, offering, right or other benefit that is made available to holders of common shares but is not, under the terms of the deposit agreement, made available to you. |
• | We and the depositary bank may rely without any liability upon any written notice, request or other document believed to be genuine and to have been signed or presented by the proper parties. |
• | We and the depositary bank also disclaim liability for any consequential or punitive damages for any breach of the terms of the deposit agreement. |
• | No disclaimer of any Securities Act liability is intended by any provision of the deposit agreement. |
• | Nothing in the deposit agreement gives rise to a partnership or joint venture, or establishes a fiduciary relationship, among us, the depositary bank and you as ADS holder. |
• | Nothing in the deposit agreement precludes Citibank (or its affiliates) from engaging in transactions in which parties adverse to us or the ADS owners have interests, and nothing in the deposit agreement obligates Citibank to disclose those transactions, or any information obtained in the course of those transactions, to us or to the ADS owners, or to account for any payment received as part of those transactions. |
• | Convert the foreign currency to the extent practical and lawful and distribute the U.S. dollars to the holders for whom the conversion and distribution is lawful and practical. |
• | Distribute the foreign currency to holders for whom the distribution is lawful and practical. |
• | Hold the foreign currency (without liability for interest) for the applicable holders. |
• | banks, insurance companies or certain other financial institutions; |
• | dealers or traders in securities who use a mark-to-market method of tax accounting; |
• | persons holding common shares or ADSs as part of a straddle, wash sale or conversion transaction or entering into a constructive sale with respect to the common shares or ADSs; |
• | persons whose functional currency for U.S. federal income tax purposes is not the U.S. dollar; |
• | persons that are subject to the “applicable financial statement” rules under Section 451(b) of the Internal Revenue Code, as amended (the “Code”) ; |
• | entities classified as partnerships for U.S. federal income tax purposes and their partners; |
• | tax-exempt entities, including “individual retirement accounts” and “Roth IRAs”; |
• | persons that own or are deemed to own ten percent or more of our stock (by vote or by value); and |
• | persons holding common shares or ADSs in connection with a trade or business conducted outside of the United States. |
• | an individual citizen or resident of the United States; |
• | a corporation, or other entity taxable as a corporation, created or organized in or under the laws of the United States, any state therein or the District of Columbia; or |
• | an estate or trust the income of which is subject to U.S. federal income taxation regardless of its source. |
Underwriter | | | Number of Common Shares |
Barclays Capital Inc. | | | |
BofA Securities, Inc. | | | |
Morgan Stanley & Co. LLC | | | |
Total | | | 40,000,000 |
| | Per ADS | |
Public offering price | | | US$ |
Underwriting commissions | | | US$ |
Proceeds, before expenses, to us | | | US$ |
(a) | transfers: |
(i) | as a bona fide gift or gifts, or for bona fide estate planning purposes; or |
(ii) | upon death or by will, testamentary document or intestacy; or |
(iii) | to any member of the lock-up party’s immediate family or to any trust for the direct or indirect benefit of the undersigned or the immediate family of the lock-up party; or |
(iv) | to a corporation, partnership, limited liability company or other entity of which the lock-up party and/or the immediate family of the lock-up party are the legal and beneficial owner of all of the outstanding equity securities or similar interests; or |
(v) | to a nominee or custodian of a person or entity to whom a disposition or transfer would be permissible under clauses (i) through (iv) above; or |
(vi) | as a distribution to limited partners or stockholders of the lock-up party; or |
(vii) | if the lock-up party is a corporation, partnership, limited liability company, trust or other business entity, (A) to the lock-up party’s affiliates or to any investment fund or other entity controlling, controlled by, managing or managed by or under common control with the lock-up party or affiliates of the lock-up party (including, for the avoidance of doubt, where the lock-up party is a partnership, to its general partner or a successor partnership or fund, or any other funds managed |
(viii) | by operation of law, such as pursuant to the rules of descent and distribution or pursuant to a qualified domestic order, or in connection with a divorce settlement, divorce decree, separation agreement or any related court order; or |
(ix) | to us from any of our employees upon death, disability or termination of employment, in each case, of such employee; or |
(x) | as part of a sale or transfer of the lock-up party’s lock-up securities acquired in open market transactions after the closing date of this offering; or |
(xi) | to us in connection with (A) the vesting, settlement, or exercise of restricted share units, options, warrants or other rights to purchase common shares (including, in each case, by way of “net” or “cashless” exercise), including for the payment of exercise price and tax and remittance payments due as a result of the vesting, settlement, or exercise of such restricted share units, options, warrants or rights, provided that any such common shares received upon such exercise, vesting or settlement shall be subject to the terms of this lock-up agreement, and provided further that any such restricted share units, options, warrants or rights are held by the lock-up party pursuant to an agreement or equity awards granted under a share incentive plan or other equity award plan, each such agreement or plan which is described in this prospectus, (B) the repurchase of common shares issued pursuant to equity awards granted under a share incentive plan or other equity award plan, limited only to a plan that is described in this prospectus or (C) a right of first refusal that the we have with respect to transfers of such shares or securities; or |
(xii) | pursuant to a bona fide third-party tender offer, merger, consolidation or other similar transaction that is approved by our Board of Directors or the majority of voting power of our share capital and made to all holders of our share capital involving a change of control (as defined below) of us (for purposes hereof, “change of control” shall mean the transfer (whether by tender offer, merger, consolidation or other similar transaction), in one transaction or a series of related transactions, to a person or group of affiliated persons, of shares if, after such transfer, such person or group of affiliated persons would hold at least a majority of our outstanding voting securities (or the surviving entity)); provided that, in the event that such tender offer, merger, consolidation or other similar transaction is not completed, the lock-up party’s lock-up securities shall remain subject to the provisions of this lock-up agreement; |
(b) | as “covering sales” in the market for payment of any taxes due in connection with the vesting of any restricted share units or other equity awards pursuant to plans described in this prospectus; |
(c) | exercise outstanding options, settle restricted share units or other equity awards or exercise warrants pursuant to plans described in this prospectus; provided that any lock-up securities received upon such exercise, vesting or settlement shall be subject to the terms of the lock-up agreement. |
• | the valuation multiples of publicly traded companies that the representatives believe to be comparable to us; |
• | our financial information; |
• | the history of, and the prospects for, our company and the industry in which we compete; |
• | an assessment of our management, its past and present operations, and the prospects for, and timing of, our future revenues; |
• | the present state of our development; |
• | the general condition of the securities markets at the time of this offering; |
• | the information set forth in this prospectus and otherwise available to the representatives; and |
• | the recent market prices of, and demand for, publicly traded common stock of generally comparable companies; and |
• | other factors deemed relevant by the underwriters and us. |
(a) | to any legal entity which is a “qualified investor” as defined under the Prospectus Regulation; |
(b) | to fewer than 150 natural or legal persons (other than “qualified investors” as defined under the Prospectus Regulation), per Relevant Member State, subject to obtaining the prior consent of the representatives for any such offer; or |
(c) | in any other circumstances falling within Article 1(4) of the Prospectus Regulation, |
(a) | to any legal entity which is a “qualified investor” as defined under the UK Prospectus Regulation; |
(b) | to fewer than 150 natural or legal persons (other than “qualified investors” as defined under the UK Prospectus Regulation), subject to obtaining the prior consent of the representatives for any such offer; or |
(c) | in any other circumstances falling within section 86 of the Financial Services and Markets Act 2000 as amended, (“FSMA”), |
• | does not constitute a disclosure document or a prospectus under Chapter 6D.2 of the Corporations Act 2001 (Cth) (the “Corporations Act”); |
• | has not been, and will not be, lodged with the Australian Securities and Investments Commission (“ASIC”), as a disclosure document for the purposes of the Corporations Act and does not purport to include the information required of a disclosure document for the purposes of the Corporations Act; and |
• | may only be provided in Australia to select investors who are able to demonstrate that they fall within one or more of the categories of investors, available under section 708 of the Corporations Act (“Exempt Investors”). |
(a) | a corporation (which is not an accredited investor (as defined in Section 4A of the SFA)) the sole business of which is to hold investments and the entire share capital of which is owned by one or more individuals, each of whom is an accredited investor; or |
(b) | a trust (where the trustee is not an accredited investor) whose sole purpose is to hold investments and each beneficiary of the trust is an individual who is an accredited investor, |
(a) | to an institutional investor or to a relevant person, or to any person arising from an offer referred to in Section 275(1A) or Section 276(4)(i)(B) of the SFA; |
(b) | where no consideration is or will be given for the transfer; |
(c) | where the transfer is by operation of law; or |
(d) | as specified in Section 276(7) of the SFA. |
| | Amount | |
Expenses | | | (US$) |
SEC registration fee | | | 21,372 |
FINRA filing fee | | | 22,350 |
NYSE listing fee | | | 204,600 |
Printing and engraving expenses | | | 65,500 |
Legal fees and expenses | | | 616,000 |
Accounting fees and expenses | | | 363,754 |
Miscellaneous expenses | | | 96,437 |
Total | | | 1,388,423 |
| | Page | |
Unaudited Condensed Consolidated Interim Financial Statements—Corporación Inmobiliaria Vesta, S.A.B. de C.V. | | | |
| | ||
| | ||
| | ||
| | ||
| |
| | ||
Audited Consolidated Financial Statements—Corporación Inmobiliaria Vesta, S.A.B. de C.V. | | | |
| | ||
| | ||
| | ||
| | ||
| | ||
| |
Assets | | | Notes | | | September 30, 2023 (Unaudited) | | | December 31, 2022 |
Current assets: | | | | | | | |||
Cash, cash equivalents and restricted cash | | | 5 | | | $408,182,657 | | | $139,147,085 |
Recoverable taxes | | | 6 | | | 31,264,979 | | | 30,088,473 |
Operating lease receivables | | | 7 | | | 8,906,561 | | | 7,690,195 |
Prepaid expenses and advance payments | | | 7.vi | | | 21,433,597 | | | 25,308,351 |
Total current assets | | | | | 469,787,794 | | | 202,234,104 | |
| | | | | | ||||
Non-current assets: | | | | | | | |||
Investment property | | | 8 | | | 3,112,803,904 | | | 2,738,465,276 |
Office furniture – Net | | | | | 1,063,465 | | | 1,437,981 | |
Right-of-use asset - Net of depreciation | | | 9 | | | 977,323 | | | 1,417,945 |
Security deposits made, restricted cash and others | | | | | 9,790,900 | | | 9,601,094 | |
Total non-current assets | | | | | 3,124,635,592 | | | 2,750,922,296 | |
| | | | | | ||||
Total assets | | | | | $3,594,423,386 | | | $2,953,156,400 | |
| | | | | | ||||
Liabilities and stockholders’ equity | | | | | | | |||
| | | | | | ||||
Current liabilities: | | | | | | | |||
Current portion of long-term debt | | | 10 | | | $4,754,756 | | | $4,627,154 |
Lease liabilities – short-term | | | 9 | | | 608,140 | | | 606,281 |
Accrued interest | | | | | 7,549,703 | | | 3,847,752 | |
Accounts payable | | | | | 16,985,635 | | | 16,628,788 | |
Income taxes payable | | | | | 42,443,745 | | | 14,824,658 | |
Accrued expenses and taxes | | | | | 5,729,315 | | | 5,154,626 | |
Dividends payable | | | 11.4 | | | 30,232,072 | | | 14,358,194 |
Total current liabilities | | | | | 108,303,366 | | | 60,047,453 | |
| | | | | | ||||
Non-current liabilities: | | | | | | | |||
Long-term debt | | | 10 | | | 923,389,058 | | | 925,872,432 |
Lease liabilities - long-term | | | 9 | | | 441,141 | | | 897,658 |
Guarantee deposits received | | | | | 22,687,764 | | | 18,333,119 | |
Long-term accounts payable | | | | | 7,706,451 | | | 7,889,937 | |
Employee benefits | | | | | 1,309,566 | | | 348,280 | |
Deferred income taxes | | | | | 309,905,581 | | | 299,979,693 | |
Total non-current liabilities | | | | | 1,265,439,561 | | | 1,253,321,119 | |
Total liabilities | | | | | 1,373,742,927 | | | 1,313,368,572 | |
| | | | | | ||||
Litigation and commitments | | | 19 | | | | | ||
| | | | | | ||||
Stockholders’ equity: | | | | | | | |||
Capital stock | | | 11.1 | | | 567,130,950 | | | 480,623,919 |
Additional paid-in capital | | | 11.3 | | | 807,101,571 | | | 460,677,234 |
Retained earnings | | | | | 875,906,418 | | | 733,405,749 | |
Share-based payments reserve | | | 17 | | | 2,010,911 | | | 5,984,051 |
Foreign currency translation | | | | | (31,469,391) | | | (40,903,125) | |
Total stockholders’ equity | | | | | 2,220,680,459 | | | 1,639,787,828 | |
Total liabilities and stockholders’ equity | | | | | $3,594,423,386 | | | $2,953,156,400 |
| | | | For the nine-month period ended | | | For the three-month period ended | ||||||||
| | Notes | | | September 30, 2023 (Unaudited) | | | September 30, 2022 (Unaudited) | | | September30, 2023 (Unaudited) | | | September 30, 2022 (Unaudited) | |
Revenues: | | | | | | | | | | | |||||
Rental income | | | 12 | | | $157,555,332 | | | $130,601,341 | | | $55,760,097 | | | $45,508,043 |
Management fees | | | | | 967,551 | | | — | | | 639,933 | | | — | |
| | | | 158,522,883 | | | 130,601,341 | | | 56,400,030 | | | 45,508,043 | ||
| | | | | | | | | | ||||||
Property operating costs related to properties that generated rental income | | | 13.1 | | | (10,325,669) | | | (6,120,112) | | | (4,444,822) | | | (2,342,554) |
Property operating costs related to properties that did not generate rental income | | | 13.1 | | | (3,046,433) | | | (1,547,058) | | | (1,400,458) | | | (591,547) |
General and administrative expenses | | | 13.2 | | | (22,340,322) | | | (18,467,192) | | | (7,320,445) | | | (5,935,594) |
| | | | | | | | | | ||||||
Interest income | | | | | 5,527,899 | | | 1,545,587 | | | 4,423,263 | | | 1,375,039 | |
Other income – Net | | | | | 2,440,371 | | | 638,167 | | | 1,707,807 | | | 257,563 | |
Finance cost | | | 14 | | | (34,748,522) | | | (34,118,391) | | | (11,395,892) | | | (11,783,272) |
Exchange gain (loss) – Net | | | | | 6,194,010 | | | (316,264) | | | (2,149,240) | | | (754,543) | |
Gain on sale of investment property | | | | | — | | | 5,027,826 | | | — | | | — | |
Gain on revaluation of investment property | | | 8 | | | 179,549,769 | | | 139,780,947 | | | 95,162,184 | | | 62,985,726 |
| | | | | | | | | | ||||||
Profit before income taxes | | | | | 281,773,986 | | | 217,024,851 | | | 130,982,427 | | | 88,718,861 | |
| | | | | | | | | | ||||||
Income tax expense | | | | | (78,966,274) | | | (52,093,615) | | | (54,764,299) | | | (26,744,384) | |
| | | | | | | | | | ||||||
Profit for the period | | | | | 202,807,712 | | | 164,931,236 | | | 76,218,128 | | | 61,974,477 | |
| | | | | | | | | | ||||||
Other comprehensive gain - Net of tax: | | | | | | | | | | | |||||
Items that may be reclassified subsequently to profit and loss: | | | | | | | | | | | |||||
- Exchange differences on translating other functional currency operations | | | | | 9,433,734 | | | 3,022,647 | | | 2,761,939 | | | 289,027 | |
Total other comprehensive income | | | | | 9,433,734 | | | 3,022,647 | | | 2,761,939 | | | 289,027 | |
| | | | | | | | | | ||||||
Total comprehensive income for the period | | | | | $212,241,446 | | | $167,953,883 | | | $78,980,067 | | | $62,263,504 | |
| | | | | | | | | | ||||||
Basic earnings per share | | | 11.5 | | | $0.2777 | | | $0.2413 | | | $0.0928 | | | $0.0912 |
Diluted earnings per share | | | 11.5 | | | $0.2734 | | | $0.2373 | | | $0.0914 | | | $0.0896 |
| | Capital stock | | | Additional paid-in capital | | | Retained earnings | | | Share-based payments reserve | | | Foreign currency translation | | | Total stockholders’ equity | |
Balances as of January 1, 2022 | | | $482,858,389 | | | $466,230,183 | | | $547,213,771 | | | $7,149,453 | | | $(49,826,389) | | | $1,453,625,407 |
Dividends declared | | | — | | | — | | | (57,432,777) | | | — | | | — | | | (57,432,777) |
Vested shares | | | 2,014,895 | | | 5,800,994 | | | — | | | (7,815,889) | | | — | | | — |
Share-based payments | | | — | | | — | | | — | | | 4,971,602 | | | — | | | 4,971,602 |
Repurchase of shares | | | (4,249,365) | | | (11,353,943) | | | — | | | — | | | — | | | (15,603,308) |
Comprehensive income | | | — | | | — | | | 164,931,236 | | | — | | | 3,022,647 | | | 167,953,883 |
| | | | | | | | | | | | |||||||
Balances as of September 30, 2022 (Unaudited) | | | $480,623,919 | | | $460,677,234 | | | $654,712,230 | | | $4,305,166 | | | $(46,803,742) | | | $1,553,514,807 |
| | | | | | | | | | | | |||||||
Balances as of January 1, 2023 | | | $480,623,919 | | | $460,677,234 | | | $733,405,749 | | | $5,984,051 | | | $(40,903,125) | | | $1,639,787,828 |
| | | | | | | | | | | | |||||||
Equity issuance | | | 84,302,445 | | | 338,375,392 | | | — | | | — | | | — | | | 422,677,837 |
Dividends declared | | | — | | | — | | | (60,307,043) | | | — | | | — | | | (60,307,043) |
Vested shares | | | 2,204,586 | | | 8,048,945 | | | — | | | (10,253,531) | | | — | | | — |
Share-based payments | | | — | | | — | | | — | | | 6,280,391 | | | — | | | 6,280,391 |
Comprehensive income | | | — | | | — | | | 202,807,712 | | | — | | | 9,433,734 | | | 212,241,446 |
| | | | | | | | | | | | |||||||
Balances as of September 30, 2023 (Unaudited) | | | $567,130,950 | | | $807,101,571 | | | $875,906,418 | | | $2,010,911 | | | $(31,469,391) | | | $2,220,680,459 |
| | September 30, 2023 (Unaudited) | | | September 30, 2022 (Unaudited) | |
Cash flows from operating activities: | | | | | ||
Profit before income taxes | | | $281,773,986 | | | $217,024,851 |
Adjustments: | | | | | ||
Depreciation | | | 570,332 | | | 949,230 |
Right-of-use asset depreciation | | | 440,622 | | | 358,560 |
Gain on revaluation of investment property | | | (179,549,769) | | | (139,780,947) |
Unrealized effect of foreign exchange rates | | | 3,239,724 | | | 316,264 |
Interest income | | | (5,527,899) | | | (1,545,587) |
Interest expense | | | 33,379,051 | | | 32,948,226 |
Amortization of debt issuance costs | | | 1,369,471 | | | 1,170,165 |
Expense recognized in respect of share-based payments | | | 6,280,391 | | | 4,971,602 |
Employee benefits and pension costs | | | 961,286 | | | — |
Gain on sale of investment property | | | — | | | (5,027,826) |
| | | | |||
Working capital adjustments: | | | | | ||
(Increase) decrease in: | | | | | ||
Operating lease receivables – Net | | | (1,216,366) | | | 1,736,636 |
Recoverable taxes | | | (1,176,506) | | | 4,879,666 |
Guarantee deposits paid | | | (437,122) | | | 4,950,174 |
Prepaid expenses | | | 3,874,754 | | | (18,241,521) |
Increase (decrease) in: | | | | | ||
Accounts payable and client advances | | | 15,933,767 | | | 33,723,994 |
Accrued expenses and taxes | | | 570,771 | | | (10,660,994) |
Security deposits collected | | | 4,354,645 | | | 2,058,410 |
Interest received | | | 5,527,899 | | | 1,545,587 |
Income taxes paid | | | (41,421,299) | | | (55,871,027) |
Net cash generated by operating activities | | | 128,947,738 | | | 75,505,463 |
| | | | |||
Cash flows from investing activities: | | | | | ||
Purchases of investment property | | | (195,666,429) | | | (182,641,651) |
Sale of investment property | | | — | | | 14,771,388 |
Purchases of office furniture and vehicles | | | (109,674) | | | (442,500) |
Net cash used in investing activities | | | (195,776,103) | | | (168,312,763) |
| | | | |||
Cash flows from financing activities: | | | | | ||
Interest paid | | | (29,677,100) | | | (29,168,137) |
Loans paid | | | (3,477,928) | | | (2,072,334) |
Dividends paid | | | (44,433,165) | | | (42,660,621) |
Equity issuance proceeds | | | 444,018,137 | | | — |
Equity issuance costs paid | | | (21,340,300) | | | — |
Repurchase of treasury shares | | | — | | | (15,603,308) |
Payment of lease liabilities | | | (536,880) | | | (413,761) |
Debt issuance costs paid | | | — | | | (1,092,916) |
Net cash from (used) in financing activities | | | 344,552,764 | | | (91,011,077) |
Effects of exchange rates changes on cash | | | (8,688,827) | | | 1,692,381 |
Net increase (decrease) in cash, cash equivalents and restricted cash | | | 269,035,572 | | | (182,125,996) |
Cash, cash equivalents and restricted cash at the beginning of year | | | 139,147,085 | | | 453,556,444 |
Cash, cash equivalents and restricted cash at the end of the period - Note 5 | | | $408,182,657 | | | $271,430,448 |
1. | General information |
1.1 | Significant event |
• | On June 29, 2023, Vesta entered into an underwriting agreement (the “Underwriting Agreement”) with Citigroup Global Markets Inc., BofA Securities, Inc. and Barclays Capital Inc., as representative of the underwriters, relating to Vesta’s initial public offering (the “Offering”) of 125,000,000 Common Shares in the form of American Depositary Shares (the “ADS”) each ADS representing 10 Common Shares of Vesta’s common stock (“common stock”), which included the exercise by the underwriters in full of the over-allotment option to purchase an additional 18,750,000 shares of Vesta’s common stock, at an Offering price of $31.00 US dollars per ADS. |
• | On September 1, 2022 Vesta announced a new $200,000,000 sustainability linked revolving credit facility with various financial institutions. As a part of such revolving credit, Vesta paid debt issuance costs in an amount of $1,092,316. As of September 30, 2023 no amount has been drawn from this revolving credit facility. |
2. | Application of new and revised International Financial Reporting Standards (IFRS) |
3. | Significant accounting policies |
a. | Basis of preparation |
i. | Historical cost |
ii. | Fair value |
• | Level 1 inputs are quoted prices (unadjusted) in active markets for identical assets or liabilities that the entity can access at the measurement date; |
• | Level 2 inputs are inputs, other than quoted prices included within Level 1, that are observable for the asset or liability, either directly or indirectly; and |
• | Level 3 inputs are unobservable inputs for the asset or liability. |
iii. | Going concern |
b. | Interim financial condensed statements |
c. | Segment |
4. | Critical accounting judgments and key sources of estimation uncertainty |
5. | Cash, cash equivalents and restricted cash |
| | September 30, 2023 (Unaudited) | | | December 31, 2022 | |
Cash and bank balances | | | $407,919,630 | | | $139,056,863 |
Restricted cash | | | 263,027 | | | 90,222 |
| | 408,182,657 | | | 139,147,085 | |
Non-current restricted cash | | | 735,312 | | | 735,312 |
Total | | | $408,917,969 | | | $139,882,397 |
6. | Recoverable taxes |
| | September 30, 2023 (Unaudited) | | | December 31, 2022 | |
Recoverable value-added tax (“VAT”) | | | $30,119,624 | | | $18,440,884 |
Recoverable income taxes | | | — | | | 9,531,645 |
Recoverable dividend tax | | | 421,209 | | | 1,818,971 |
Other receivables | | | 724,146 | | | 296,973 |
| | $31,264,979 | | | $30,088,473 |
7. | Operating lease receivables, prepaid expenses and advance payments |
i. | The aging profile of operating lease receivables as of the dates indicated below are as follows: |
| | September 30, 2023 (Unaudited) | | | December 31, 2022 | |
0-30 days | | | $7,438,650 | | | $6,732,985 |
30-60 days | | | 498,021 | | | 260,832 |
60-90 days | | | 309,711 | | | 610,770 |
Over 90 days | | | 325,275 | | | 85,608 |
Total | | | $8,571,657 | | | $7,690,195 |
ii. | Movement in the allowance for doubtful accounts receivable |
| | Amounts | |
Balance as of January 1, 2022 | | | $1,957,935 |
Increase in loss allowance recognized in the period | | | 180,609 |
Decrease in loss allowance from derecognition of financial assets in the period | | | (477,802) |
Balance as of September 30, 2022 (Unaudited) | | | $1,660,742 |
| | ||
Balance as of January 1, 2023 | | | $1,916,124 |
Increase in loss allowance recognized in the period | | | 684,174 |
Decrease in loss allowance from derecognition of financial assets in the period | | | (333,523) |
Balance as of September 30, 2023 (Unaudited) | | | $2,266,775 |
iii. | Client concentration risk |
iv. | Leasing agreements |
v. | Non-cancellable operating lease receivables |
| | September 30, 2023 (Unaudited) | | | December 31, 2022 | |
Not later than 1 year | | | $198,044,817 | | | $155,267,112 |
Later than 1 year and not later than 3 years | | | 326,887,221 | | | 250,043,235 |
Later than 3 year and not later than 5 years | | | 306,239,134 | | | 209,592,871 |
Later than 5 years | | | 195,524,025 | | | 154,909,895 |
| | $1,026,695,197 | | | $769,813,113 |
vi. | Prepaid expenses and advance payments |
| | September 30, 2023 (Unaudited) | | | December 31, 2022 | |
Advance payments(1) | | | $19,630,091 | | | $17,201,933 |
Other accounts receivables(2) | | | 737,227 | | | 7,486,147 |
Property expenses | | | 822,012 | | | 543,804 |
Prepaid expenses | | | 244,267 | | | 76,467 |
| | $21,433,597 | | | $25,308,351 |
(1) | During the second quarter of 2022 the Entity entered into an agreement for the procurement, permissioning and other condition of several plots of land; if the conditions are met within a period of 18 months, or an additional 18-month extension, the advance deposit will be considered part of the final transaction price, otherwise approximately $1 million will be forfeited to the counterparty and expensed; the remainder amount will be reimbursed to the Entity. |
(2) | As state in Note 8 the Entity sold land reserves located in Queretaro, the outstanding balance as of December 31, 2022 was received in the first quarter of 2023. |
8. | Investment property |
Property | | | Fair value hierarchy | | | Valuation techniques | | | Significant unobservable inputs | | | Value/range | | | Relationship of unobservable inputs to fair value |
Buildings and land | | | Level 3 | | | Discounted cash flows | | | Discount rate | | | Q3 2023: 7.00% to 12.21% 2022: 7.50% to 12.24% | | | The higher the discount rate, the lower the fair value. |
| | | | | | | | | | ||||||
| | | | | | Exit cap rate | | | Q3 2023: 6.50% to 8.75% 2022: 6.50% to 8.99% | | | The higher the exit cap rate, the lower the fair value | |||
| | | | | | | | | | ||||||
| | | | | | Long-term NOI | | | Based on contractual rent and then on market related rents | | | The higher the NOI, the higher the fair value. | |||
| | | | | | | | | | ||||||
| | | | | | Inflation rates | | | Mexico: Q3 2023: 3.6% to 5.0% 2022: 3.4% to 5.0% U.S.: Q3 2023: 2.2% to 3.5% 2022: 2.1% to 3.5% | | | The higher the inflation rate, the higher the fair value. | |||
| | | | | | | | | | ||||||
| | | | | | Absorption period | | | 12 months on average | | | The shorter the absorption period, the higher the fair value. | |||
| | | | | | | | | | ||||||
| | | | | | Market Related rents | | | Depending on the park/state | | | The higher the market rent, the higher the fair value | |||
| | | | | | | | | | ||||||
Land reserves | | | Level 3 | | | Market value | | | Price per acre | | | Weighted average price per acre Q3 2023: $190,573 2022: $239,266 | | | The higher the price, the higher the fair value. |
| | September 30, 2023 (Unaudited) | | | December 31, 2022 | |
Buildings and land | | | $3,101,690,000 | | | $2,657,513,766 |
Land improvements | | | 13,794,975 | | | 7,562,174 |
Land reserves | | | 140,100,000 | | | 208,910,000 |
| | 3,255,584,975 | | | 2,873,985,940 | |
Less: Cost to conclude construction in-progress | | | (142,781,071) | | | (135,520,664) |
Balance at end of period | | | $3,112,803,904 | | | $2,738,465,276 |
| | September 30, 2023 (Unaudited) | | | September 30, 2022 (Unaudited) | |
Balance at beginning of year | | | $2,738,465,276 | | | $2,263,170,941 |
Additions | | | 179,906,022 | | | 182,641,651 |
Foreign currency translation effect | | | 14,882,837 | | | 1,404,973 |
Disposal of investment property | | | — | | | (9,743,562) |
Gain on revaluation of investment property | | | 179,549,769 | | | 139,780,947 |
Balance at end of period | | | $3,112,803,904 | | | $2,577,254,950 |
9. | Entity as lessee |
1. | Right-of-use: |
Right-of-use | | | January 1, 2023 | | | Additions | | | Disposals | | | September 30, 2023 (Unaudited) |
Property | | | $2,552,121 | | | $— | | | $— | | | $2,552,121 |
Vehicles and office equipment | | | 791,773 | | | — | | | — | | | 791,773 |
Cost of right-of-use | | | $3,343,894 | | | $— | | | $— | | | $3,343,894 |
| | | ||||||||||
Depreciation of right-of-use | | | | | | | | | ||||
Property | | | $(1,508,871) | | | $(341,928) | | | $— | | | $(1,850,799) |
Vehicles and office equipment | | | (417,078) | | | (98,694) | | | — | | | (515,772) |
Accumulated depreciation | | | (1,925,949) | | | (440,622) | | | — | | | (2,366,571) |
Total | | | $1,417,945 | | | $(440,622) | | | $— | | | $977,323 |
Rights to use | | | January 1, 2022 | | | Additions | | | Disposals | | | September 30, 2022 (Unaudited) |
Property | | | $2,296,581 | | | $— | | | $— | | | $2,296,581 |
Vehicles and office equipment | | | 411,357 | | | — | | | — | | | 411,357 |
Cost of rights to use | | | 2,707,938 | | | — | | | — | | | 2,707,938 |
Rights to use | | | January 1, 2022 | | | Additions | | | Disposals | | | September 30, 2022 (Unaudited) |
Depreciation of rights to use | | | | | | | | | ||||
Property | | | $(1,078,035) | | | (294,759) | | | $— | | | $(1,372,794) |
Vehicles and office equipment | | | (285,486) | | | (63,801) | | | — | | | (349,287) |
Accumulated depreciation | | | (1,363,521) | | | (358,560) | | | — | | | (1,722,081) |
Total | | | $1,344,417 | | | (358,560) | | | $— | | | 985,857 |
2. | Lease obligations: |
| | January 1, 2023 | | | Additions | | | Disposals | | | Interests accrued | | | Repayments | | | September 30, 2023 (Unaudited) | |
Lease liabilities | | | $1,503,939 | | | $— | | | $— | | | $82,222 | | | $(536,871) | | | $1,049,290 |
| | January 1, 2022 | | | Additions | | | Disposals | | | Interests accrued | | | Repayments | | | September 30, 2022 (Unaudited) | |
Lease liabilities | | | $1,380,413 | | | $— | | | $— | | | $46,728 | | | $(413,761) | | | $1,013,380 |
3. | Analysis of maturity of liabilities by lease: |
Finance lease liabilities | | | September 30, 2023 (Unaudited) | | | December 31, 2022 |
Not later than 1 year | | | $675,318 | | | $709,901 |
Later than 1 year and not later than 5 years | | | 461,197 | | | 963,487 |
| | 1,136,515 | | | 1,673,388 | |
Less: future finance cost | | | (87,234) | | | (169,449) |
Total lease liability | | | $1,049,281 | | | $1,503,939 |
Finance lease – short-term | | | 608,140 | | | 606,281 |
Finance lease – long-term | | | 441,141 | | | 897,658 |
Total lease liability | | | $1,049,281 | | | $1,503,939 |
10. | Long-term debt |
Loan | | | Amount | | | Annual interest rate | | | Monthly amortization | | | Maturity | | | September 30, 2023 (Unaudited) | | | December 31, 2022 |
MetLife 10-year | | | 150,000,000 | | | 4.55% | | | (1) | | | August 2026 | | | $144,877,457 | | | $146,723,915 |
Series A Senior Note | | | 65,000,000 | | | 5.03% | | | (3) | | | September 2024 | | | 65,000,000 | | | 65,000,000 |
Series B Senior Note | | | 60,000,000 | | | 5.31% | | | (3) | | | September 2027 | | | 60,000,000 | | | 60,000,000 |
Series A Senior Note | | | 45,000,000 | | | 5.50% | | | (3) | | | May 2025 | | | 45,000,000 | | | 45,000,000 |
Series B Senior Note | | | 45,000,000 | | | 5.85% | | | (3) | | | May 2028 | | | 45,000,000 | | | 45,000,000 |
MetLife 10-year | | | 118,000,000 | | | 4.75% | | | (2) | | | December 2027 | | | 116,551,550 | | | 117,867,109 |
MetLife 8-year | | | 26,600,000 | | | 4.75% | | | (1) | | | August 2026 | | | 25,725,410 | | | 26,041,321 |
Series RC Senior Note | | | 70,000,000 | | | 5.18% | | | (4) | | | June 2029 | | | 70,000,000 | | | 70,000,000 |
Series RD Senior Note | | | 15,000,000 | | | 5.28% | | | (5) | | | June 2031 | | | 15,000,000 | | | 15,000,000 |
Vesta ESG Global bond 35/8 05/31 | | | 350,000,000 | | | 3.63% | | | (6) | | | May 2031 | | | 350,000,000 | | | 350,000,000 |
| | | | | | | | | | 937,154,417 | | | 940,632,345 | |||||
Less: Current portion | | | | | | | | | | | (4,754,756) | | | (4,627,154) | ||||
Less: Direct issuance cost | | | | | | | | | | | (9,010,603) | | | (10,132,759) | ||||
Total Long-term debt | | | | | | | | | | | $923,389,058 | | | $925,872,432 |
(1) | On July 22, 2016 the Entity entered into a 10-year loan agreement with MetLife, interest on this loan is paid on a monthly basis. On March 2021, under this credit facility, an additional loan was contracted for $26,600,000 bearing interest on a monthly basis at a fixed interest rate of 4.75%. Principal amortization over the two loans will commence on September 1, 2023. This credit facility is guaranteed with 48 of the Entity’s properties. |
(2) | On November 1, 2017, the Entity entered into a 10-year loan agreement with Metlife, interest on this loan is paid on a monthly basis. The loan bears monthly interest only for 60 months and thereafter monthly amortizations of principal and interest until it matures on December 1, 2027. This loan is secured by 21 of the Entity’s investment properties under a Guarantee Trust. |
(3) | Series A Senior Notes and Series B Senior Notes are not secured by investment properties of the Entity. The interest on these notes is paid on a monthly basis. |
(4) | On June 25, 2019, the Entity entered into a 10-year senior notes series RC to financial institutions, interest on these loans is paid on a semiannual basis December 14, 2019. The note payable matures on June 14, 2029. Five of its subsidiaries are joint obligators under these notes payable. |
(5) | On June 25, 2019, the Entity entered into a 12-year note payable to financial institutions, interest on these loans is are paid on a semiannual basis beginning December 14, 2019. The note payable matures on June 14, 2031. Five of its subsidiaries are joint obligators under these notes payable. |
(6) | On May 13, 2021, the Entity offered $350,000,000 Senior Notes, Vesta ESG Global bond 35/8 05/31 with maturity on May 13, 2031. Interest is paid on a semiannual basis. The cost incurred for this issuance was $7,746,222. |
11. | Capital stock |
1. | Capital stock as of September 30, 2023 and December 31, 2022 is as follows: |
| | September 30, 2023 (Unaudited) | | | December 31, 2022 | |||||||
| | Number of shares | | | Amount | | | Number of shares | | | Amount | |
Fixed capital Series A | | | 5,000 | | | $3,696 | | | 5,000 | | | $3,696 |
Variable capital Series B | | | 827,604,128 | | | 567,127,254 | | | 679,697,740 | | | 480,620,223 |
Total | | | 827,609,128 | | | $567,130,950 | | | 679,702,740 | | | $480,623,919 |
2. | Shares in treasury |
| | September 30, 2023 (Unaudited) | | | December 31, 2022 | |
Shares in treasury(1) | | | 5,721,638 | | | 10,077,405 |
Shares in long term incentive plan trust(2) | | | 8,665,670 | | | 8,456,290 |
Total share in treasury | | | 14,377,308 | | | 18,533,695 |
(1) | Treasury shares are not included in the Total Capital Stock of the Entity, they represent the total stock outstanding under the repurchase program approved by the resolution of the general ordinary stockholders meeting on March 13, 2020. |
(2) | Shares in long-term incentive plan trust are not included in the Total Capital Stock of the Entity. The trust was established in 2018 in accordance with the resolution of the general ordinary stockholders meeting on January 6, 2015 as the 20-20 Long Term Incentive Plan, this compensation plan was extended for the period 2021 to 2025, “Long Term Incentive Plan” by a resolution of the general ordinary stockholders meeting on March 13, 2020. Such trust was created by the Entity as a vehicle to distribute shares to employees under the mentioned incentive plan (see Note 17) and is consolidated by the Entity. The shares granted to the eligible executives and deposited in the trust accrue dividends for the employee any time the ordinary shareholders receive dividends and those dividends do not need to be returned to the Entity if the executive forfeits the granted shares. |
3. | Fully paid ordinary shares |
| | Number of shares | | | Capital stock | | | Additional paid-in capital | |
Balance as of January 1, 2022 | | | 684,252,628 | | | $ 482,858,389 | | | $ 466,230,183 |
Vested shares | | | 4,161,111 | | | 2,014,895 | | | 5,800,995 |
Repurchase of shares | | | (8,710,999) | | | (4,249,365) | | | (11,353,944) |
Balance as of December 31, 2022 | | | 679,702,740 | | | $ 480,623,919 | | | $ 460,677,234 |
Vested shares | | | 4,156,388 | | | 2,204,586 | | | 8,048,945 |
Equity issuance | | | 143,750,000 | | | 84,302,445 | | | 338,375,392 |
Balance as of September 30, 2023 (unaudited) | | | 827,609,128 | | | $567,130,950 | | | $807,101,571 |
4. | Dividend payments |
5. | Earnings per share |
| | For the nine-month period ended | | | For the three-month period ended | |||||||
| | September 30, 2023 (Unaudited) | | | September 30, 2022 (Unaudited) | | | September 30, 2023 (Unaudited) | | | September 30, 2022 (Unaudited) | |
Basic earnings per share: | | | | | | | | | ||||
Earnings attributable to ordinary share to outstanding | | | $202,807,712 | | | $164,931,236 | | | $76,218,128 | | | $61,974,477 |
Weighted average number of ordinary shares outstanding | | | 730,196,124 | | | 683,633,759 | | | 821,359,128 | | | 679,745,465 |
Basic earnings per share | | | $0.2777 | | | $0.2413 | | | $0.0928 | | | $0.0912 |
| | For the nine-month period ended | | | For the three-month period ended | |||||||
| | September 30, 2023 (Unaudited) | | | September 30, 2022 (Unaudited) | | | September 30, 2023 (Unaudited) | | | September 30, 2022 (Unaudited) | |
Diluted earnings per share: | | | | | | | | | ||||
Earnings attributable to ordinary shares outstanding and shares in Incentive Plan Trust | | | $202,807,712 | | | $164,931,236 | | | $76,218,128 | | | $61,974,477 |
Weighted average number of ordinary shares plus shares in Incentive Plan trust | | | 741,922,679 | | | 695,063,086 | | | 833,707,935 | | | 691,894,891 |
Diluted earnings per share | | | $0.2734 | | | $0.2373 | | | $0.0914 | | | $0.0896 |
12. | Rental income |
| | For the nine-month period ended | | | For the three-month period ended | |||||||
| | September 30, 2023 (Unaudited) | | | September 30, 2022 (Unaudited) | | | September 30, 2023 (Unaudited) | | | September 30, 2022 (Unaudited) | |
Rents | | | $147,287,405 | | | $123,997,898 | | | $51,613,071 | | | $42,809,466 |
Reimbursable building services | | | 10,267,927 | | | 6,603,443 | | | 4,147,026 | | | 2,698,577 |
Total rental income | | | $ 157,555,332 | | | $ 130,601,341 | | | $ 55,760,097 | | | $ 45,508,043 |
13. | Property operating costs and administration expenses |
1. | Property operating costs consist of the following: |
a. | Direct property operating costs from investment properties that generate rental income during the period: |
| | For the nine-month period ended | | | For the three-month period ended | |||||||
| | September 30, 2023 (Unaudited) | | | September 30, 2022 (Unaudited) | | | September 30, 2023 (Unaudited) | | | September 30, 2022 (Unaudited) | |
Real estate tax | | | $1,888,429 | | | $1,334,014 | | | $712,580 | | | $446,788 |
Insurance | | | 712,438 | | | 521,948 | | | 316,808 | | | 175,710 |
Maintenance | | | 1,366,211 | | | 1,018,868 | | | 539,544 | | | 404,779 |
Structural maintenance accrual | | | 83,632 | | | 85,239 | | | 28,929 | | | 30,777 |
Other property related expenses | | | 6,274,959 | | | 3,160,043 | | | 2,846,962 | | | 1,284,500 |
| | $10,325,669 | | | $6,120,112 | | | $4,444,823 | | | $2,342,554 |
b. | Direct property operating costs from investment property that do not generate rental income during the period: |
| | For the nine-month period ended | | | For the three-month period ended | |||||||
| | September 30, 2023 (Unaudited) | | | September 30, 2022 (Unaudited) | | | September 30, 2023 (Unaudited) | | | September 30, 2022 (Unaudited) | |
Real estate tax | | | $440,326 | | | $224,950 | | | $172,233 | | | $70,548 |
Insurance | | | 19,849 | | | 23,963 | | | 10,531 | | | 7,615 |
Maintenance | | | 357,757 | | | 272,554 | | | 173,384 | | | 119,704 |
Other property related expenses | | | 2,228,501 | | | 1,025,591 | | | 1,044,310 | | | 393,680 |
| | 3,046,433 | | | 1,547,058 | | | 1,400,458 | | | 591,547 | |
Total property operating costs | | | $13,372,102 | | | $7,667,170 | | | $5,845,280 | | | $2,934,101 |
2. | General and administrative expenses consist of the following: |
| | For the nine-month period ended | | | For the three-month period ended | |||||||
| | September 30, 2023 (Unaudited) | | | September 30, 2022 (Unaudited) | | | September 30, 2023 (Unaudited) | | | September 30, 2022 (Unaudited) | |
Employee annual salary plus short-terms benefits | | | $12,436,861 | | | $10,347,765 | | | $4,241,595 | | | $3,264,076 |
Auditing, legal and consulting expenses | | | 1,543,483 | | | 708,426 | | | 897,584 | | | 242,004 |
Property appraisal and other fees | | | 426,232 | | | 508,761 | | | 148,440 | | | 172,680 |
Marketing expenses | | | 564,959 | | | 699,252 | | | 277,065 | | | 212,246 |
Other | | | 77,442 | | | 146,213 | | | (296,812) | | | 3,740 |
| | 15,048,977 | | | 12,410,417 | | | 5,267,872 | | | 3,894,746 | |
Depreciation | | | 1,010,954 | | | 1,085,173 | | | 265,962 | | | 405,601 |
Long-term incentive plan and Equity plus - Note 17.4 | | | 6,280,391 | | | 4,971,602 | | | 1,786,611 | | | 1,635,247 |
Total general and administrative expenses | | | $22,340,322 | | | $18,467,192 | | | $7,320,445 | | | $5,935,594 |
14. | Finance Cost |
| | For the nine-month period ended | | | For the three-month period ended | |||||||
| | September 30, 2023 (Unaudited) | | | September 30, 2022 (Unaudited) | | | September 30, 2023 (Unaudited) | | | September 30, 2022 (Unaudited) | |
Interest on loans and others | | | $33,626,366 | | | $32,948,226 | | | $11,283,518 | | | $11,328,934 |
Loan prepayment fees | | | 1,122,156 | | | 1,170,165 | | | 112,374 | | | 454,338 |
Total | | | $34,748,522 | | | $34,118,391 | | | $11,395,892 | | | $11,783,272 |
15. | Income taxes |
16. | Transactions and balances with related parties |
| | For the nine-month period ended | | | For the three-month period ended | |||||||
| | September 30, 2023 (Unaudited) | | | September 30, 2022 (Unaudited) | | | September 30, 2023 (Unaudited) | | | September 30, 2022 (Unaudited) | |
Short-term benefits | | | $5,058,489 | | | $4,561,286 | | | $1,665,982 | | | $1,348,314 |
Share-based compensation expense | | | 6,280,391 | | | 4,971,602 | | | 1,786,611 | | | 1,635,247 |
| | $11,338,880 | | | $9,532,888 | | | $3,442,593 | | | $2,983,561 | |
Number of key executives | | | 23 | | | 22 | | | 23 | | | 22 |
17. | Share-based payment |
17.1 | Share units granted during the period |
17.2 | Share units vested during the period |
17.3 | Share awards outstanding at the end of the period |
17.4 | Compensation expense recognized |
| | For the nine-month period ended | | | For the three-month period ended | |||||||
| | September 30, 2023 (Unaudited) | | | September 30, 2022 (Unaudited) | | | September 30, 2023 (Unaudited) | | | September 30, 2022 (Unaudited) | |
Vesta 20-20 Incentive Plan | | | $6,280,391 | | | $4,971,602 | | | $1,786,611 | | | $1,635,247 |
18. | Interest rate risk management |
19. | Litigation and commitments |
20. | Events after the reporting period |
21. | Condensed consolidated interim financial statements issuance authorization |
| | Notes | | | December 31, 2022 | | | December 31, 2021 | |
Assets | | | | | | | |||
Current assets: | | | | | | | |||
Cash, cash equivalents and restricted cash | | | 5 | | | $139,147,085 | | | $452,821,132 |
Recoverable taxes | | | 6 | | | 30,088,473 | | | 19,377,562 |
Operating lease receivables | | | 7 | | | 7,690,195 | | | 9,039,147 |
Prepaid expenses and other current assets | | | 7.vi | | | 25,308,351 | | | 483,581 |
Total current assets | | | | | 202,234,104 | | | 481,721,422 | |
| | | | | | ||||
Non-current assets: | | | | | | | |||
Investment property | | | 8 | | | 2,738,465,276 | | | 2,263,170,941 |
Office furniture – Net | | | | | 1,437,981 | | | 2,119,589 | |
Right-of-use asset | | | 9 | | | 1,417,945 | | | 1,344,417 |
Guarantee deposits made, restricted cash and others | | | | | 9,601,094 | | | 11,510,701 | |
Total non-current assets | | | | | 2,750,922,296 | | | 2,278,145,648 | |
| | | | | | ||||
Total assets | | | | | $2,953,156,400 | | | $2,759,867,070 | |
| | | | | | ||||
Liabilities and stockholders’ equity | | | | | | | |||
Current liabilities: | | | | | | | |||
Current portion of long-term debt | | | 10 | | | $4,627,154 | | | $2,880,592 |
Lease liabilities - short term | | | 9 | | | 606,281 | | | 464,456 |
Accrued interest | | | | | 3,847,752 | | | 3,840,079 | |
Accounts payable | | | 3.f | | | 16,628,788 | | | 3,011,415 |
Income tax payable | | | | | 14,824,658 | | | 27,838,872 | |
Accrued expenses and taxes | | | | | 5,154,626 | | | 15,246,156 | |
Dividends payable | | | 11.4 | | | 14,358,194 | | | 13,944,232 |
Total current liabilities | | | | | 60,047,453 | | | 67,225,802 | |
| | | | | | ||||
Non-current liabilities: | | | | | | | |||
Long-term debt | | | 10 | | | 925,872,432 | | | 930,652,624 |
Lease liabilities - long term | | | 9 | | | 897,658 | | | 915,957 |
Guarantee deposits received | | | | | 18,333,119 | | | 15,868,704 | |
Long-term account payable | | | 3.f | | | 7,889,937 | | | — |
Employee benefits | | | | | 348,280 | | | — | |
Deferred income taxes | | | 16.3 | | | 299,979,693 | | | 291,578,576 |
Total non-current liabilities | | | | | 1,253,321,119 | | | 1,239,015,861 | |
| | | | | | ||||
Total liabilities | | | | | $1,313,368,572 | | | $1,306,241,663 | |
| | | | | | ||||
Litigation and other contingencies | | | 19 | | | | | ||
| | | | | | ||||
Stockholders’ equity: | | | | | | | |||
Capital stock | | | 11 | | | 480,623,919 | | | 482,858,389 |
Additional paid-in capital | | | 11.3 | | | 460,677,234 | | | 466,230,183 |
Retained earnings | | | | | 733,405,749 | | | 547,213,771 | |
Share-based payments reserve | | | 19 | | | 5,984,051 | | | 7,149,453 |
Foreign currency translation | | | | | (40,903,125) | | | (49,826,389) | |
| | | | | | ||||
Total stockholders’ equity | | | | | 1,639,787,828 | | | 1,453,625,407 | |
| | | | | | ||||
Total liabilities and stockholders’ equity | | | | | $2,953,156,400 | | | $2,759,867,070 |
| | Notes | | | December 31,2022 | | | December 31,2021 | |
Revenues: | | | | | | | |||
Rental income | | | 12 | | | $178,025,461 | | | $160,698,385 |
Management fees | | | | | — | | | 87,973 | |
| | | | 178,025,461 | | | 160,786,358 | ||
| | | | | | ||||
Property operating costs related to properties that generated rental income | | | 13.1a | | | (8,940,789) | | | (8,543,961) |
Property operating costs related to properties that did not generate rental income | | | 13.1b | | | (2,482,605) | | | (2,182,796) |
General and administrative expenses | | | 13.2 | | | (24,414,428) | | | (21,400,917) |
| | | | | | ||||
Interest income | | | | | 2,640,687 | | | 76,871 | |
Other income – net | | | 15 | | | 956,862 | | | 27,795 |
Finance cost | | | 14 | | | (46,396,156) | | | (50,263,493) |
Exchange gain (loss)- net | | | | | 1,939,848 | | | (1,109,567) | |
Gain on sale of investment property | | | | | 5,027,826 | | | 13,992,675 | |
Gain on revaluation of investment property | | | 8 | | | 185,491,518 | | | 164,649,959 |
| | | | | | ||||
Profit before income taxes | | | | | 291,848,224 | | | 256,032,924 | |
| | | | | | ||||
Current income tax expense | | | 16.1 | | | (41,981,391) | | | (50,262,466) |
Deferred income tax | | | 16.1 | | | (6,242,079) | | | (31,828,085) |
Total income tax expense | | | | | (48,223,470) | | | (82,090,551) | |
| | | | | | ||||
Profit for the year | | | | | 243,624,754 | | | 173,942,373 | |
| | | | | | ||||
Other comprehensive income (loss) - net of tax: | | | | | | | |||
Items that may be reclassified subsequently to profit - Fair value gain on derivative instruments | | | 17 | | | — | | | 2,892,985 |
Exchange differences on translating other functional currency operations | | | | | 8,923,264 | | | (4,844,991) | |
Total other comprehensive income (loss) | | | | | 8,923,264 | | | (1,952,006) | |
| | | | | | ||||
Total comprehensive income for the year | | | | | 252,548,018 | | | 171,990,367 | |
| | | | | | ||||
Basic earnings per share | | | 11.5 | | | 0.3569 | | | 0.2683 |
| | | | | | ||||
Diluted earnings per share | | | 11.5 | | | $0.3509 | | | $0.2636 |
| | Capital Stock | | | Additional Paid-in Capital | | | Retained Earnings | | | Share-Based Payments Reserve | | | Foreign Currency Translation | | | Valuation of Derivative financial instruments | | | Total Stockholders’ Equity | |
| | | | | | | | | | | | | | ||||||||
Balance as of January 1, 2021 | | | $422,437,615 | | | $297,064,471 | | | $429,048,327 | | | $7,986,137 | | | $(44,981,398) | | | $(2,892,985) | | | $1,108,662,167 |
| | | | | | | | | | | | | | ||||||||
Equity issuance | | | 58,773,174 | | | 164,422,275 | | | — | | | — | | | — | | | — | | | 223,195,449 |
Shared-based payments | | | — | | | — | | | — | | | 5,554,353 | | | — | | | — | | | 5,554,353 |
Vested shares | | | 1,647,600 | | | 4,743,437 | | | — | | | (6,391,037) | | | — | | | — | | | — |
Dividends declared | | | — | | | — | | | (55,776,929) | | | — | | | — | | | — | | | (55,776,929) |
Comprehensive income (loss) | | | — | | | — | | | 173,942,373 | | | — | | | (4,844,991) | | | 2,892,985 | | | 171,990,367 |
| | | | | | | | | | | | | | ||||||||
Balances as of December 31, 2021 | | | 482,858,389 | | | 466,230,183 | | | 547,213,771 | | | 7,149,453 | | | (49,826,389) | | | — | | | 1,453,625,407 |
| | | | | | | | | | | | | | ||||||||
Share-based payments | | | — | | | — | | | — | | | 6,650,487 | | | — | | | — | | | 6,650,487 |
Vested shares | | | 2,014,895 | | | 5,800,994 | | | — | | | (7,815,889) | | | — | | | — | | | — |
Dividends declared | | | — | | | — | | | (57,432,777) | | | — | | | — | | | — | | | (57,432,777) |
Repurchase of shares | | | (4,249,365) | | | (11,353,943) | | | — | | | — | | | — | | | — | | | (15,603,308) |
Comprehensive income (loss) | | | — | | | — | | | 243,624,754 | | | — | | | 8,923,264 | | | — | | | 252,548,018 |
| | | | | | | | | | | | | | ||||||||
Balances as of December 31, 2022 | | | $480,623,919 | | | $460,677,234 | | | $733,405,748 | | | $5,984,051 | | | $(40,903,125) | | | $— | | | $1,639,787,827 |
| | December 31,2022 | | | December 31,2021 | |
| | | | |||
Cash flows from operating activities: | | | | | ||
Profit before income taxes | | | $291,848,224 | | | $256,032,924 |
Adjustments: | | | | | ||
Depreciation | | | 901,492 | | | 1,143,134 |
Right-of-use depreciation | | | 562,428 | | | 458,082 |
Gain on revaluation of investment property | | | (185,491,518) | | | (164,649,959) |
Unrealized effect of foreign exchange rates | | | (1,939,848) | | | 1,109,567 |
Interest income | | | (2,640,687) | | | (76,871) |
Interest expense | | | 44,852,043 | | | 45,482,028 |
Amortization of debt issuance costs | | | 1,544,113 | | | 4,781,465 |
Expense recognized in respect of share-based payments | | | 6,650,487 | | | 5,554,353 |
Gain on sale of investment property | | | (5,027,826) | | | (13,992,675) |
Employee benefits | | | 348,280 | | | — |
| | | | |||
Working capital adjustments: | | | | | ||
(Increase) decrease in: | | | | | ||
Operating lease receivables - Net | | | 1,348,952 | | | (2,678,246) |
Recoverable taxes | | | (10,710,911) | | | (4,516,452) |
Guarantee deposits paid | | | 1,909,607 | | | (7,004,175) |
Prepaid expenses | | | (17,338,623) | | | (63,524) |
Increase (decrease) in: | | | | | ||
Accounts payable | | | (1,619,312) | | | (230,177) |
Accrued expenses and taxes | | | (10,091,530) | | | 10,936,516 |
Guarantee deposits collected | | | 2,464,415 | | | 1,944,455 |
Financial assets held for trading | | | — | | | 684,936 |
Interest received | | | 2,640,687 | | | 76,871 |
Income taxes paid | | | (54,995,605) | | | (27,062,220) |
Net cash generated by operating activities | | | 65,214,868 | | | 107,930,032 |
| | | | |||
Cash flows from investing activities: | | | | | ||
Purchases of investment property | | | (269,222,961) | | | (108,394,270) |
Sale of investment property | | | 7,285,242 | | | 124,565,539 |
Purchases of office furniture and vehicles | | | (219,884) | | | (219,143) |
Net cash (used in) generated by investing activities | | | (262,157,603) | | | 15,952,126 |
| | | | |||
Cash flows from financing activities: | | | | | ||
Interest paid | | | (44,844,370) | | | (44,474,123) |
Loans obtained | | | — | | | 350,000,000 |
Loans paid | | | — | | | (252,500,000) |
Costs of debt issuance | | | (1,667,278) | | | (7,746,222) |
Dividends paid | | | (57,018,815) | | | (55,367,252) |
Repurchase of treasury shares | | | (15,603,308) | | | — |
Equity issuance | | | — | | | 229,215,419 |
Costs of equity issuance | | | — | | | (6,019,970) |
Payment of lease liabilities | | | (647,961) | | | (564,677) |
Net cash generated by financing activities | | | (119,781,732) | | | 212,543,175 |
| | | | |||
Effects of exchange rates changes on cash | | | 3,050,420 | | | (4,146,343) |
Net (decrease) increase in cash, cash equivalents and restricted cash | | | (313,674,047) | | | 332,278,990 |
| | | | |||
Cash, cash equivalents and restricted cash at the beginning of year | | | 453,556,444 | | | 121,277,454 |
| | | | |||
Cash, cash equivalents and restricted cash at the end of year - Note 5 | | | $139,882,397 | | | $453,556,444 |
1. | General information |
1.1 | Significant events |
2. | Adoption of new and revised International Financial Reporting Standards |
Amendments to IFRS 3 Reference to the Conceptual Framework | | | The Entity has adopted the amendments to IFRS 3 Business Combinations for the first time in the current year. The amendments update IFRS 3 so that it refers to the 2018 Conceptual Framework instead of the 1989 Framework. They also add to IFRS 3 a requirement that, for obligations within the scope of IAS 37 Provisions, Contingent Liabilities and Contingent Assets, an acquirer applies IAS 37 to determine whether at the acquisition date a present obligation exists as a result of past events. For a levy that would be within the scope of IFRIC 21 Levies, the acquirer applies IFRIC 21 to determine whether the obligating event that gives rise to a liability to pay the levy has occurred by the acquisition date. |
| | ||
Amendments to IAS 16 - Property, Plant and Equipment - Income before its planned use | | | The Entity has adopted the amendments to IAS 16 Property Plant and Equipment for the first time this year. The amendments prohibit deducting from the cost of a property, plant, and equipment asset any income from the sale of goods produced before it is ready for use, for example, income generated while the asset is moved to a location and refurbished. necessary to make it operable in the manner that it is intended in accordance with the intentions of the administration. Consequently, an entity must recognize those sales revenues and costs in profit or loss. The entity measures the costs of those goods produced in accordance with IAS 2 Inventories. |
| | ||
| | The amendments also clarify the meaning of 'testing whether an asset is working properly'. Now, IAS 16 specifies this as an assessment in which the physical and technical performance of the asset is capable of being used in the production or supply of goods or services, for rental or other, or administrative purposes. | |
| | ||
| | If not presented separately in the statement of comprehensive income, the financial statements shall disclose the amounts of revenue and cost in profit or loss related to items that are not an output from the ordinary activities of the entity, in the line item(s) in the statement of comprehensive income where revenues and costs are included. | |
| | ||
Annual Improvements to IFRS Accounting Standards 2018-2020 | | | The Entity has adopted the amendments included in the Annual Improvements to IFRS Accounting Standards 2018-2020 Cycle for the first time in the current year. The Annual Improvements include amendments to four standards. |
| | ||
Amendments to IFRS 9 - Financial Instruments | | | The amendment clarifies that in applying the '10 per cent' test to assess whether to derecognize a financial liability, an entity includes only fees paid or received between the entity (the borrower) and the lender, including fees paid or received by either the entity or the lender on the other’s behalf. |
Amendments to IAS 1 | | | Classification of liabilities as current or non-current. |
| | ||
Amendments to IAS 1 and Practice Statement 2 | | | Disclosure of accounting policies |
| | ||
Amendments to IAS 8 | | | Definition of accounting estimates |
| | ||
Amendments to IAS 12 | | | Deferred taxes related to assets and liabilities arising from a single transaction |
• | A change in an accounting estimate is the result of new information or a new development, not the correction of an error. |
• | The effects of a change in an input or a valuation technique used to develop an accounting estimate are changes in accounting estimates if they do not result from a correction of prior period errors. |
• | A deferred tax asset (to the extent it is probable that taxable income is available against the deductible temporary difference) and a deferred tax liability for all taxable and temporary deductions associated with: |
○ | Right-of-use assets and lease liabilities |
○ | Liabilities for decommissioning, restoration and other similar liabilities and the corresponding amounts recognized as part of the cost of the related assets. |
• | The cumulative effect of the initial application of the amendments as an adjustment to the opening balance of retained earnings (or some other component of equity, as applicable) as of that date. |
3. | Significant accounting policies |
a. | Statement of compliance |
b. | Basis of preparation |
i. | Historical cost |
ii. | Fair value |
• | Level 1 fair value measurements are those derived from quoted prices (unadjusted) in active markets for identical assets or liabilities that the entity can access at the measurement date; |
• | Level 2 fair value measurements are those derived from inputs, other than quoted prices included within Level 1, that are observable for the asset or liability, either directly or indirectly; and |
• | Level 3 fair value measurements are those derived from valuation techniques that include inputs for the asset or liability that are not based on observable market data. |
iii. | Going concern |
c. | Basis of consolidation |
• | Has power over the investee; |
• | Is exposed, or has rights, to variable returns from its involvement with the investee; and |
• | Has the ability to use its power to affect its returns. |
| | Ownership percentage | | | |||||
Subsidiary/Entity | | | 2022 | | | 2021 | | | Activity |
QVC, S. de R.L. de C.V. | | | 99.99% | | | 99.99% | | | Holds investment properties |
QVC II, S. de R.L. de C.V. | | | 99.99% | | | 99.99% | | | Holds investment properties |
WTN Desarrollos Inmobiliarios de México, S. de R.L. de C.V. | | | 99.99% | | | 99.99% | | | Holds investment properties |
Vesta Baja California, S. de R.L. de C.V. | | | 99.99% | | | 99.99% | | | Holds investment properties |
Vesta Bajío, S. de R.L. de C.V. | | | 99.99% | | | 99.99% | | | Holds investment properties |
| | | | | | ||||
Vesta Queretaro, S. de R.L. de C.V. | | | 99.99% | | | 99.99% | | | Holds investment properties |
Proyectos Aeroespaciales, S. de R.L. de C.V. | | | 99.99% | | | 99.99% | | | Holds investment properties |
Vesta DSP, S. de R. L. de C.V. | | | 99.99% | | | 99.99% | | | Holds investment properties |
Vesta Management, S. de R.L. de C.V. | | | 99.99% | | | 99.99% | | | Provides specialized administrative services (REPSE # AR12757/2022) |
Servicio de Administración y Mantenimiento Vesta, S. de R.L. de C.V. | | | 99.99% | | | 99.99% | | | Provide specialized administrative services (REPSE # AR17617/2022) |
Enervesta, S. de R.L. de C.V. | | | 99.99% | | | 99.99% | | | Provides administrative services to the Entity |
Trust CIB 2962 | | | (1) | | | (1) | | | Vehicle to distribute shares to employees under the Long Term Incentive plan. |
(1) | Employee share trust established in conjunction with the 20-20 Long Term Incentive Plan over which the Entity exercise control. |
d. | Financial instruments |
e. | Financial assets |
• | The financial asset is held within a business model whose objective is to hold financial assets in order to collect contractual cash flows; and |
• | The contractual terms of the financial asset give rise on specified dates to cash flows that are solely payments of principal and interest on the principal amount outstanding. |
• | The financial asset is held within a business model whose objective is achieved by both collecting contractual cash flows and selling the financial assets; and |
• | The contractual terms of the financial asset give rise on specified dates to cash flows that are solely payments of principal and interest on the principal amount outstanding. |
• | The Entity may irrevocably elect to present subsequent changes in fair value of an equity investment in other comprehensive income if certain criteria are met (see (iii) below); and |
• | The Entity may irrevocably designate a debt investment that meets the amortized cost or FVTOCI criteria as measured at FVTPL if doing so eliminates or significantly reduces an accounting mismatch (see (iv) below). |
(i) | Amortized cost and effective interest method |
(ii) | Debt instruments classified at fair value through other comprehensive income |
(iii) | Equity investments designated as Fair Value through other comprehensive income |
• | It has been obtained with the main objective of being sold in the short term; or |
• | On initial recognition, it is part of a portfolio of identified financial instruments that the Entity manages together and has evidence of a recent pattern of obtaining profits in the short term; or |
• | It is a derivative (except for derivatives that are contractual financial guarantees or an effective hedging instrument). |
(iv) | Financial Assets at fair value through profit or loss |
• | Equity investments instruments are classified at fair value through profit or loss, unless the Entity designates an equity investment that is not held for trading or a contingent consideration arising from a business combination at fair value through other comprehensive income on initial recognition (see (iii) above). |
• | Debt instruments that do not meet the amortized cost criteria or the fair value criteria through other comprehensive income (see (i) and (ii) above) are classified with fair value through income. In addition, debt instruments that meet the amortized cost criteria or the fair value criteria through other comprehensive income may be designated as fair value through income at the time of initial recognition if such designation eliminates or significantly reduces an inconsistency of measurement or recognition (called “accounting disparity”) that would arise from the measurement of assets or liabilities or the recognition of gains and losses on them on different bases. The Entity has not designated any debt instrument with fair value through results. |
• | For financial assets measured at amortized cost that are not part of a designated hedging relationship, exchange differences are recognized in income under the heading “other gains and losses”; |
• | For debt instruments measured at fair value through other comprehensive income that are not part of a designated hedging relationship, exchange differences in the amortized cost of the debt instrument are recognized in income under the heading of “other income and losses”. Other exchange differences are recognized in other comprehensive income in the investment revaluation reserve; |
• | For financial assets measured at fair value through results that are not part of a designated hedging relationship, exchange differences are recognized in income under “other gains and losses”; and |
• | For equity instruments measured at fair value through other comprehensive income, exchange differences are recognized in other comprehensive income in the investment revaluation reserve. |
(i) | Significant increase in credit risk |
• | An existing or expected significant impairment in the external (if any) or internal rating of the financial instrument; |
• | Significant impairment in external market indicators of credit risk for a specific financial instrument, for example, a significant increase in the credit spread, credit default swap for the debtor, or the period of time or the extent to which the value fair value of a financial asset is less than its amortized cost; |
• | Existing or expected adverse changes in economic, financial or business conditions that are expected to cause a significant decrease in the debtor's ability to meet its debt obligation; |
• | A current or expected significant impairment in the debtor's operating results; |
• | Significant increases in credit risk in other financial instruments of the same debtor; |
• | An existing or expected adverse change in the debtor's regulatory, economic or technological conditions that result in a significant decrease in the debtor's ability to meet its obligations. |
(1) | The financial instrument has a low default risk, |
(2) | The debtor has a notable ability to meet its contractual cash flow obligations in the short term, and |
(3) | Adverse changes in economic and business conditions in the long term may reduce the ability of the debtor to meet its contractual cash obligations, but will not necessarily happen. |
(ii) | Definition of non-compliance |
• | When the debtor breaches the financial agreements; |
• | Information developed internally or obtained from external sources indicates that it is unlikely that the debtor will pay its creditors, including the Entity, in full (without taking into account any guarantees that the Entity has). |
(iii) | Credit Impaired Financial Assets |
(a) | Significant financial difficulty on the part of the issuer or the debtor; |
(b) | The breach of a contract, such as a default or an expired event (see (ii) above); |
(c) | The debtor's lenders, for economic or contractual reasons related to the debtor's financial difficulty, grant the debtor a concession that the lenders would not otherwise consider; |
(d) | It is increasingly likely that the debtor will enter bankruptcy or some other financial reorganization; or |
(e) | The extinction of a functional market for the financial asset due to its financial difficulties. |
(iv) | Write-off policy |
(v) | Measurement and recognition of expected credit losses |
f. | Financial liabilities |
• | It has been acquired principally for the purpose of repurchasing it in the near term; or |
• | On initial recognition it is part of a portfolio of identified financial instruments that the Entity manages together and has a recent actual pattern of short-term profit-taking; or |
• | It is a derivative, except for a derivative that is a financial guarantee contract or a designated and effective hedging instrument. |
• | A financial liability other than a financial liability held for trading or contingent consideration of an acquirer in a business combination may be designated as at FVTPL upon initial recognition if: |
• | Such designation eliminates or significantly reduces a measurement or recognition inconsistency that would otherwise arise; or |
• | The financial liability forms part of an Entity of financial assets or financial liabilities or both, which is managed and its performance is evaluated on a fair value basis, in accordance with the Entity’s documented risk management or investment strategy, and information about the grouping is provided internally on that basis; or |
• | It forms part of a contract containing one or more embedded derivatives, and IFRS 9 permits the entire combined contract to be designated as at FVTPL. |
| | December 31, 2022 | | | December 31, 2021 | |
Construction in-progress(1) | | | $13,369,927 | | | $354,012 |
Land(2) | | | 366,975 | | | — |
Existing properties | | | 2,239,163 | | | 385,369 |
Others accounts payable | | | 652,723 | | | 2,272,034 |
| | $16,628,788 | | | $3,011,415 |
(1) | At the end of fiscal year 2022, the Entity began the construction of six investment properties, the amount represents the accounts payable, which will be settled during the first quarter of the following year. |
(2) | During the third quarter of 2022 the Entity acquired a land reserve and signed promissory agreements for a total of $8,256,912 to be paid on quarterly installments of $91,744 starting March 2023 plus a final payment of $7,431,218 in June 2025; the long-term payable portion is $7,889,937. |
g. | Derivative financial instruments |
h. | Hedge accounting |
• | There is an economic relationship between the hedging instrument and the hedged item; |
• | The effect of credit risk does not dominate the value of the changes that result from the economic relationship; and |
• | The hedging ratio of the hedging relationship is the same as that resulting from the amount of the hedged item that the Entity actually covers and the amount of the hedging instrument that the Entity actually uses to cover that amount of the hedged item. |
i. | Cash and cash equivalents |
j. | Office furniture |
k. | Restricted cash and guarantee deposits |
l. | Investment property |
m. | Impairment of long-lived assets other than goodwill |
n. | Leases |
1) | The Entity as lessor |
2) | The Entity as lessee |
• | Fixed lease payments (including in-substance fixed payments), less any lease incentives; |
• | Variable lease payments that depend on an index or rate, initially measured using the index or rate at the commencement date; |
• | The amount expected to be payable by the lessee under residual value guarantees; |
• | The exercise price of purchase options, if the lessee is reasonably certain to exercise the options; and |
• | Payments of penalties for terminating the lease, if the lease term reflects the exercise of an option to terminate the lease. |
• | The lease term is modified or there is a significant event or change in the circumstances of the lease resulting in a change in the evaluation of the purchase option exercise, in which case the lease liability is measured by discounting the updated rent payments using a updated discount rate. |
• | Rent payments are modified as a result of changes in indices or rate or a change in the expected payment under a guaranteed residual value, in which cases the lease liability is revalued by discounting the updated rent payments using the same discount rate (unless the change in rent payments is due to a change in a variable interest rate, in which case an updated discount rate is used). |
• | A lease is modified and the lease modification is not accounted for as a separate lease, in which case the lease liability is revalued based on the lease term of the modified lease, discounting the updated rent payments using a discount rate updated on the date of entry into force of the modification. |
o. | Foreign currencies |
p. | Employee benefits |
q. | Share-based payment arrangements |
r. | Income taxes |
1. | Current tax |
2. | Deferred income tax |
3. | Current and deferred tax for the year |
s. | Provisions |
t. | Revenue recognition |
u. | Segment |
4. | Critical accounting judgments and key sources of estimation uncertainty |
— | Valuation of investment properties |
5. | Cash, cash equivalents and restricted cash |
| | December 31, 2022 | | | December 31, 2021 | |
Cash and cash equivalents | | | $139,056,863 | | | $452,802,049 |
Current restricted cash | | | 90,222 | | | 19,083 |
| | 139,147,085 | | | 452,821,132 | |
Non-current restricted cash | | | 735,312 | | | 735,312 |
Total | | | $139,882,397 | | | $453,556,444 |
6. | Recoverable taxes |
| | December 31, 2022 | | | December 31, 2021 | |
Recoverable value-added tax (“VAT”) | | | $18,440,884 | | | $6,193,929 |
Recoverable income taxes | | | 9,531,645 | | | 9,530,937 |
Recoverable dividend tax | | | 1,818,971 | | | 3,533,983 |
Other receivables | | | 296,973 | | | 118,713 |
| | $30,088,473 | | | $19,377,562 |
7. | Operating lease receivables |
i. | The aging profile of operating lease receivables as of the dates indicated below are as follows: |
| | December 31, 2022 | | | December 31, 2021 | |
0-30 days | | | $6,732,985 | | | $8,345,097 |
30-60 days | | | 260,832 | | | 263,033 |
60-90 days | | | 610,770 | | | 269,054 |
Over 90 days | | | 85,608 | | | 161,963 |
Total | | | $7,690,195 | | | $9,039,147 |
ii. | Movement in the allowance for doubtful accounts receivable |
| | 2022 | | | 2021 | |
Balance as of January 1 | | | $1,957,935 | | | $3,507,156 |
Increase in loss allowance arising from new financial assets recognized in the year | | | 760,072 | | | 1,516,248 |
Decrease in loss allowance from derecognition of financial assets in the year | | | (801,883) | | | (3,065,469) |
Balance as of December 31 | | | $1,916,124 | | | $1,957,935 |
iii. | Client concentration risk |
iv. | Leasing agreements |
v. | Non-cancellable operating lease receivables |
| | 2022 | | | 2021 | |
Not later than 1 year | | | $155,267,112 | | | $140,816,013 |
Later than 1 year and not later than 3 years | | | 250,043,235 | | | 213,202,071 |
Later than 3 year and not later than 5 years | | | 209,592,871 | | | 169,944,066 |
Later than 5 years | | | 154,909,895 | | | 102,405,961 |
| | $769,813,113 | | | $626,368,111 |
vi. | Prepaid expenses and other current assets |
| | 31/12/2022 | | | 31/12/2021 | |
Advance deposit(1) | | | $17,201,933 | | | $— |
Other accounts receivables(2) | | | 7,486,147 | | | — |
Property expenses | | | 543,804 | | | — |
Prepaid expenses | | | 76,467 | | | 483,581 |
| | $25,308,351 | | | $483,581 |
(1) | During the second quarter of 2022 the Entity entered into an agreement for the procurement, permissioning and other conditions for the acquisition of several plots of land; if the conditions are met within a period of 18 months, or an additional 18-month extension, the advance deposit will be considered part of the final transactions price, otherwise approximately $1 million will be forfeited to the counterparty and expensed; the remainder amount will be reimbursed to the Entity. |
(2) | As stated in Note 8 the Entity sold land reserve locate in Queretaro, and as of December 2022, there is an outstanding balance settled in the first quarter of 2023. |
8. | Investment property |
Property | | | Fair value hierarchy | | | Valuation techniques | | | Significant unobservable inputs | | | Value/range | | | Relationship of unobservable inputs to fair value |
Buildings and land | | | Level 3 | | | Discounted cash flows | | | Discount rate | | | 2022: 7.50% to 12.24% 2021: 7.75% to 12.15% | | | The higher the discount rate, the lower the fair value. |
| | | | | | | | | |||||||
| | | | | | Exit cap rate | | | 2022: 6.50% to 8.99% 2021: 6.75% to 8.99% | | | The higher the exit cap rate, the lower the fair value. | |||
| | | | | | | | | | ||||||
| | | | | | Long-term NOI | | | Based on contractual rent and then on market related rents | | | The higher the NOI, the higher the fair value. | |||
| | | | | | | | | | ||||||
| | | | | | Inflation rates | | | Mexico: 3.4% to 5.0% in 2022, 3.55% to 4.15% in 2021 U.S.: 2.1% to 3.5% in 2022, 2.3% to 3.0% in 2021 | | | The higher the inflation rate, the higher the fair value. |
Property | | | Fair value hierarchy | | | Valuation techniques | | | Significant unobservable inputs | | | Value/range | | | Relationship of unobservable inputs to fair value |
| | | | | | Absorption period | | | 12 months of average | | | The shorter the absorption period, the higher the fair value | |||
| | | | | | | | | | ||||||
| | | | | | Market related rents | | | Depending on the park/state | | | The higher the market rent the higher the fair value | |||
| | | | | | | | | | ||||||
Land reserves | | | Level 3 | | | Market comparable | | | Price per acre | | | Weighted average price per acre is $239,266 in 2022, $149,453 in 2021 | | | The higher the price, the higher the fair value. |
| | December 31, 2022 | |||||||
| | Impact of +10 bps on exit cap rate | | | Impact of +10 bps on discount rate | | | Impact of +10 bps on exit cap rate and discount rate | |
Buildings and land (decrease) | | | $(12,177,562) | | | $(20,763,362) | | | $(21,538,398) |
| | December 31, 2021 | |||||||
| | Impact of +10 bps on exit cap rate | | | Impact of +10 bps on discount rate | | | Impact of +10 bps on exit cap rate and discount rate | |
Buildings and land (decrease) | | | $(15,072,887) | | | $(15,978,900) | | | $(29,857,968) |
| | 2022 | | | 2021 | |
Buildings and land | | | $2,657,513,766 | | | $2,167,895,680 |
Land improvements | | | 7,562,174 | | | 7,975,906 |
Land reserves | | | 208,910,000 | | | 133,859,180 |
| | 2,873,985,940 | | | 2,309,730,766 | |
Less: Cost to conclude construction in-progress | | | (135,520,664) | | | (46,559,825) |
Balance at end of year | | | $2,738,465,276 | | | $2,263,170,941 |
| | 2022 | | | 2021 | |
Balance at beginning of year | | | $2,263,170,941 | | | $2,103,214,762 |
Additions | | | 292,349,582 | | | 109,032,511 |
Foreign currency translation effect | | | 7,196,797 | | | (3,742,001) |
Disposal of investment property | | | (9,743,562) | | | (109,984,290) |
Gain on revaluation of investment property | | | 185,491,518 | | | 164,649,959 |
Balance at end of year | | | $2,738,465,276 | | | $2,263,170,941 |
9. | Lease liabilities |
1. | Rights-of-use: |
Rights-of-use | | | January 1, 2022 | | | Additions | | | Disposals | | | December 31, 2022 |
Office space | | | $2,296,581 | | | $255,540 | | | $— | | | $2,552,121 |
Vehicles and office furniture | | | 411,357 | | | 380,416 | | | — | | | 791,773 |
Cost of rights-of-use | | | $2,707,938 | | | $635,956 | | | $— | | | $3,343,894 |
| | | | | | | |
Rights-of-use | | | January 1, 2022 | | | Additions | | | Disposals | | | December 31, 2022 |
Depreciation of rights-of-use | | | | | | | | | ||||
Office space | | | $(1,078,035) | | | $(430,836) | | | $— | | | $(1,508,871) |
Vehicles and office furniture | | | (285,486) | | | (131,592) | | | — | | | (417,078) |
Accumulated depreciation | | | (1,363,521) | | | (562,428) | | | — | | | (1,925,949) |
Total | | | $1,344,417 | | | $73,528 | | | $— | | | $1,417,945 |
Rights-of-use | | | January 1, 2021 | | | Additions | | | Disposals | | | December 31, 2021 |
Office space | | | $1,260,626 | | | $1,035,955 | | | $— | | | $2,296,581 |
Vehicles and office furniture | | | 302,650 | | | 108,707 | | | — | | | 411,357 |
Cost of rights-of-use | | | $1,563,276 | | | $1,144,662 | | | $— | | | $2,707,938 |
| | | | | | | | |||||
Depreciation of rights-of-use | | | | | | | | | ||||
Office space | | | $(717,375) | | | $(360,660) | | | $— | | | $(1,078,035) |
Vehicles and office furniture | | | (188,064) | | | (97,422) | | | — | | | (285,486) |
Accumulated depreciation | | | (905,439) | | | (458,082) | | | — | | | (1,363,521) |
Total | | | $657,837 | | | $686,580 | | | $— | | | $1,344,417 |
2. | Lease obligations: |
| | January 1, 2022 | | | Additions | | | Disposals | | | Interests accrued | | | Repayments | | | December 31, 2022 | |
Lease liabilities | | | $1,380,413 | | | $635,956 | | | $— | | | $135,531 | | | $(647,961) | | | $1,503,939 |
| | January 1, 2021 | | | Additions | | | Disposals | | | Interests paid | | | Repayments | | | December 31, 2021 | |
Lease liabilities | | | $731,285 | | | $1,144,662 | | | $— | | | $69,143 | | | $(564,677) | | | $1,380,413 |
3. | Analysis of maturity of liabilities by lease: |
Finance lease liabilities | | | 2022 |
Less than 1 year | | | $709,901 |
Later than 1 year and not later than 5 years | | | 963,487 |
| | 1,673,388 | |
Less: future finance cost | | | (169,449) |
Total lease liability | | | $1,503,939 |
Finance lease - short term | | | 606,281 |
Finance lease - long term | | | 897,658 |
Total lease liability | | | $1,503,939 |
10. | Long-term debt |
Loan | | | Amount | | | Annual interest rate | | | Monthly amortization | | | Maturity | | | 31/12/2022 | | | 31/12/2021 |
MetLife 10-year | | | 150,000,000 | | | 4.55% | | | (1) | | | August 2026 | | | 146,723,915 | | | 149,071,012 |
Series A Senior Note | | | 65,000,000 | | | 5.03% | | | (3) | | | September 2024 | | | 65,000,000 | | | 65,000,000 |
Series B Senior Note | | | 60,000,000 | | | 5.31% | | | (3) | | | September 2027 | | | 60,000,000 | | | 60,000,000 |
Series A Senior Note | | | 45,000,000 | | | 5.50% | | | (3) | | | May 2025 | | | 45,000,000 | | | 45,000,000 |
Series B Senior Note | | | 45,000,000 | | | 5.85% | | | (3) | | | May 2028 | | | 45,000,000 | | | 45,000,000 |
MetLife 10-year | | | 118,000,000 | | | 4.75% | | | (2) | | | December 2027 | | | 117,867,109 | | | 118,000,000 |
MetLife 8-year | | | 26,600,000 | | | 4.75% | | | (1) | | | August 2026 | | | 26,041,321 | | | 26,441,925 |
Series RC Senior Note | | | 70,000,000 | | | 5.18% | | | (4) | | | June 2029 | | | 70,000,000 | | | 70,000,000 |
Series RD Senior Note | | | 15,000,000 | | | 5.28% | | | (5) | | | June 2031 | | | 15,000,000 | | | 15,000,000 |
Vesta ESG Global bond 35/8 05/31 | | | 350,000,000 | | | 3.625% | | | (6) | | | May 2031 | | | 350,000,000 | | | 350,000,000 |
| | | | | | | | | | 940,632,345 | | | 943,512,937 | |||||
Less: Current portion | | | | | | | | | | | (4,627,154) | | | (2,880,592) | ||||
Less: Direct issuance cost | | | | | | | | | | | (10,132,759) | | | (9,979,721) | ||||
Total Long-term debt | | | | | | | | | | | $925,872,432 | | | $930,652,624 |
(1) | On July 22, 2016 the Entity entered into a 10-year loan agreement with MetLife, interest on this loan is paid on a monthly basis. On March 2021, under this credit facility, an additional loan was contracted for $26,600,000 bearing interest on a monthly basis at a fixed interest rate of 4.75%. Principal amortization over the two loans will commence on September 1, 2023. This credit facility is guaranteed with 48 of the Entity’s properties. |
(2) | On November 1, 2017, the Entity entered into a 10-year loan agreement with Metlife, interest on this loan is paid on a monthly basis. The loan bears monthly interest only for 60 months and thereafter monthly amortizations of principal and interest until it matures on December 1, 2027. This loan is secured by 21 of the Entity’s investment properties under a Guarantee Trust. |
(3) | Series A Senior Notes and Series B Senior Notes are not secured by investment properties of the Entity. The interest on these notes is paid on a monthly basis. |
(4) | On June 25, 2019, the Entity entered into a 10-year senior notes series RC to financial institutions, interest on these loans is paid on a semiannual basis December 14, 2019. The note payable matures on June 14, 2029. Five of its subsidiaries are joint obligators under these notes payable. |
(5) | On June 25, 2019, the Entity entered into a 12-year note payable to financial institutions, interest on these loans is are paid on a semiannual basis beginning December 14, 2019. The note payable matures on June 14, 2031. Five of its subsidiaries are joint obligators under these notes payable. |
(6) | On May 13, 2021, the Entity offered $350,000,000 Senior Notes, Vesta ESG Global bond 35/8 05/31 with maturity on May 13, 2031. Interest is paid on a semiannual basis. The cost incurred for this issuance was $7,746,222. |
2024 | | | $69,811,407 |
2025 | | | 50,081,269 |
2026 | | | 165,594,809 |
2027 | | | 170,517,706 |
2028 | | | 45,000,000 |
Thereafter | | | 435,000,000 |
Less: direct issuance cost | | | (10,132,759) |
Total long-term debt | | | $925,872,432 |
11. | Capital stock |
1. | Capital stock as of December 31, 2022 and 2021 is as follows: |
| | 2022 | | | 2021 | |||||||
| | Number of shares | | | Amount | | | Number of shares | | | Amount | |
Fixed capital Series A | | | 5,000 | | | $3,696 | | | 5,000 | | | $3,696 |
Variable capital Series B | | | 679,697,740 | | | 480,620,223 | | | 684,247,628 | | | 482,854,693 |
Total | | | 679,702,740 | | | $480,623,919 | | | 684,252,628 | | | $482,858,389 |
2. | Treasury shares |
| | 2022 | | | 2021 | |
Treasury shares(1) | | | 10,077,405 | | | 5,652,438 |
Shares in Long-term incentive plan trust(2) | | | 8,456,290 | | | 8,331,369 |
Total Treasury shares | | | 18,533,695 | | | 13,983,807 |
(1) | Treasury shares are not included in the Total Capital Stock of the Entity, they represent the total stock outstanding under the repurchase program approved by the resolution of the general ordinary stockholders meeting on March 13, 2020. |
(2) | Shares in long-term incentive plan trust are not included in the Total Capital Stock of the Entity. The trust was established in 2018 in accordance with the resolution of the general ordinary stockholders meeting on January 6, 2015 as the 20-20 Long Term Incentive Plan, this compensation plan was extended for the period 2021 to 2025, “Long Term Incentive Plan” by a resolution of the general ordinary stockholders meeting on March 13, 2020. Such trust was created by the Entity as a vehicle to distribute shares to employees under the mentioned incentive plan (see Note 18) and is consolidated by the Entity. The shares granted to the eligible executives and deposited in the trust accrue dividends for the employee any time the ordinary shareholders receive dividends and those dividends do not need to be returned to the Entity if the executive forfeits the granted shares. |
3. | Fully paid ordinary shares |
| | Number of shares | | | Amount | | | Additional paid-in capital | |
Balance as of January 1, 2021 | | | 564,214,433 | | | $422,437,615 | | | $297,064,471 |
Vested shares | | | 3,258,637 | | | 1,647,600 | | | 4,743,437 |
Equity issuance | | | 116,779,558 | | | 58,773,174 | | | 164,422,275 |
Balance as of December 31, 2021 | | | 684,252,628 | | | 482,858,389 | | | 466,230,183 |
Vested shares | | | 4,161,111 | | | 2,014,895 | | | 5,800,995 |
Repurchase of shares | | | (8,710,999) | | | (4,249,365) | | | (11,353,944) |
Balance as of December 31, 2022 | | | 679,702,740 | | | $480,623,919 | | | $460,677,234 |
4. | Dividend payments |
Period | | | Amount | | | Reinvested earnings | | | Distributed earnings(1) | | | Amount that may be subject to withholding | | | Amount not subject to withholding |
Retained earnings through December 31, 2013 | | | $204,265,028 | | | $204,265,028 | | | $204,265,028 | | | $— | | | $— |
2014 | | | 24,221,997 | | | 24,221,997 | | | 24,221,997 | | | — | | | — |
2016 | | | 45,082,793 | | | 45,082,793 | | | 45,082,793 | | | — | | | — |
2017 | | | 126,030,181 | | | 126,030,181 | | | 88,264,623 | | | 37,765,558 | | | — |
2018 | | | 93,060,330 | | | 93,060,330 | | | — | | | 93,060,330 | | | — |
2019 | | | 134,610,709 | | | 134,610,709 | | | — | | | 134,610,709 | | | — |
2020 | | | 66,956,082 | | | 66,956,082 | | | — | | | 66,956,082 | | | — |
2021 | | | 173,942,373 | | | 173,942,373 | | | — | | | 173,942,373 | | | — |
2022 | | | 291,848,224 | | | 291,848,224 | | | — | | | — | | | — |
(1) | Dividend paid in 2019, were distributed form earnings generated in 2014 and 2016, which were reinvested until the days in which the dividends were paid. Dividend paid in 2020 were distributed from earnings generated in 2017. Dividends paid in 2021 and 2022 were distributed from earnings generated in 2013 and 2017. |
5. | Earnings per share |
| | December 31, 2022 | | | December 31, 2021 | |
Basic Earnings per share | | | | | ||
Earnings attributable to ordinary shares outstanding | | | $243,624,754 | | | $173,942,373 |
Weighted average number of ordinary shares outstanding | | | 682,642,927 | | | 648,418,962 |
Basic Earnings per share | | | 0.3569 | | | 0.2683 |
Diluted Earnings per share | | | | | ||
Earnings attributable to ordinary shares outstanding and shares in Long-term Incentive Plan | | | $243,624,754 | | | $173,942,373 |
Weighted average number of ordinary shares plus shares in Long-term Incentive Plan | | | 694,253,758 | | | 692,934,852 |
Diluted earnings per share | | | 0.3509 | | | 0.2636 |
12. | Rental income |
| | December 31, 2022 | | | December 31, 2021 | |
Rents | | | $168,707,094 | | | $154,954,624 |
Reimbursable building services | | | 9,318,367 | | | 5,743,761 |
| | $178,025,461 | | | $160,698,385 |
13. | Property operating costs and General and administrative expenses |
1. | Property operating costs consist of the following: |
a. | Direct property operating costs from investment properties that generated rental income during the year: |
| | December 31, 2022 | | | December 31, 2021 | |
Real estate tax | | | $1,831,436 | | | $1,887,480 |
Insurance | | | 691,462 | | | 655,883 |
Maintenance | | | 1,624,366 | | | 1,559,539 |
Structural maintenance accrual | | | 110,403 | | | 105,228 |
Trust fees | | | 110,439 | | | 106,752 |
Other property related expenses | | | 4,572,683 | | | 4,229,079 |
| | $8,940,789 | | | $8,543,961 |
b. | Direct property operating costs from investment property that did not generate rental income during the year: |
| | December 31, 2022 | | | December 31, 2021 | |
Real estate tax | | | $328,919 | | | $449,403 |
Insurance | | | 42,973 | | | 63,388 |
Maintenance | | | 458,178 | | | 403,167 |
Other property related expenses | | | 1,652,535 | | | 1,266,838 |
| | 2,482,605 | | | 2,182,796 | |
Total property operating | | | $11,423,394 | | | $10,726,757 |
2. | General and administrative expenses consist of the following: |
| | December 31, 2022 | | | December 31, 2021 | |
Employee annual salary plus short-terms benefits | | | $13,501,686 | | | $11,744,548 |
Auditing, legal and consulting expenses | | | 971,629 | | | 815,843 |
Property appraisal and other fees | | | 682,905 | | | 683,681 |
Marketing expenses | | | 1,026,804 | | | 871,705 |
Other | | | 116,997 | | | 129,571 |
| | 16,300,021 | | | 14,245,348 | |
Depreciation | | | 1,463,920 | | | 1,601,216 |
Long-term incentive plan and Equity plus - Note 18.3 | | | 6,650,487 | | | 5,554,353 |
Total | | | $24,414,428 | | | $21,400,917 |
14. | Finance costs |
| | December 31, 2022 | | | December 31, 2021 | |
Interest on loans | | | $44,852,043 | | | $44,665,243 |
Loan prepayment fees | | | 1,544,113 | | | 5,598,250 |
Total | | | $46,396,156 | | | $50,263,493 |
15. | Other income - net |
| | December 31, 2022 | | | December 31, 2021 | |
Insurance recovery | | | $963,347 | | | $102,943 |
Inflationary effect on tax recovery | | | 145,437 | | | 43,980 |
(Loss) gain on sale of office equipment | | | (47,242) | | | 3,555 |
Commissions paid | | | (104,680) | | | (122,684) |
Total | | | $956,862 | | | $27,794 |
16. | Income taxes |
16.1 | Income taxes are as follows: |
| | December 31, 2022 | | | December 31, 2021 | |
ISR expense: | | | | | ||
Current | | | $41,981,391 | | | $50,262,466 |
Deferred | | | 6,242,079 | | | 31,828,085 |
Total income taxes | | | $48,223,470 | | | $82,090,551 |
16.2 | The effective ISR rates for fiscal 2022 and 2021 differ from the statutory rate as follows: |
| | December 31, 2022 | | | December 31, 2021 | |
Statutory rate | | | 30% | | | 30% |
Effects of exchange rates on tax balances | | | (20%) | | | (7%) |
Effects of inflation | | | 7% | | | 9% |
Effective rate | | | 17% | | | 32% |
16.3 | The main items originating the deferred ISR liability are: |
| | December 31, 2022 | | | December 31, 2021 | |
Deferred ISR assets (liabilities): | | | | | ||
Investment property | | | $(302,909,300) | | | $(291,729,224) |
Effect of tax loss carryforwards | | | 5,461 | | | — |
Other provisions and prepaid expenses | | | 2,924,146 | | | 150,648 |
Deferred income taxes - Net | | | $(299,979,693) | | | $(291,578,576) |
16.4 | A reconciliation of the changes in the deferred tax liability balance is presented as follows: |
| | December 31, 2022 | | | December 31, 2021 | |
Deferred tax liability at the beginning of the period | | | $(291,578,576) | | | $(260,873,091) |
Movement included in profit or loss | | | (6,242,079) | | | (31,828,085) |
Movement included in other comprehensive income | | | (2,159,038) | | | 1,122,600 |
Deferred tax liability at the end of the year | | | $(299,979,693) | | | $(291,578,576) |
17. | Financial instruments |
17.1 | Capital management |
17.2 | Leverage ratio |
| | 2022 | | | 2021 | |
Debt | | | $930,499,586 | | | $933,533,216 |
Cash, cash equivalents and restricted cash | | | (139,147,085) | | | (452,821,132) |
Financial assets held for trading | | | — | | | — |
Net debt | | | 791,352,501 | | | 480,712,084 |
Equity | | | 1,639,787,828 | | | 1,453,625,407 |
Net debt to equity ratio | | | 48% | | | 33% |
17.3 | Categories of financial instruments |
17.4 | Financial risk management objectives |
17.5 | Market risk |
17.6 | Foreign currency risk management |
| | December 31, 2022 | | | December 31, 2021 | |
Exchange rates: | | | | | ||
Mexican pesos per US dollar at the end of the period | | | 19.3615 | | | 20.5835 |
Mexican pesos per US dollar average during the year | | | 20.1249 | | | 20.2818 |
Monetary assets: | | | | | ||
Mexican pesos | | | $229,361,977 | | | $249,437,217 |
US dollars | | | 263,033 | | | 1,486,635 |
Monetary liabilities: | | | | | ||
Mexican pesos | | | $260,708,893 | | | $195,227,796 |
US dollars | | | 30,979,579 | | | 33,081,624 |
17.7 | Foreign currency sensitivity analysis |
| | December 31, 2022 | | | December 31, 2021 | |
Profit or loss impact: | | | | | ||
Mexican peso - 10% appreciation - gain | | | $147,185 | | | $(239,421) |
Mexican peso - 10% depreciation - loss | | | (179,893) | | | 292,626 |
U.S. dollar - 10% appreciation - loss | | | (59,471,840) | | | (65,033,544) |
U.S. dollar - 10% depreciation - gain | | | 59,471,840 | | | 65,033,544 |
17.8 | Interest rate risk management |
17.9 | Credit risk management |
17.10 | Liquidity risk management |
| | Weighted average interest rate % | | | 1 to 3 months | | | 3 months to 1 year | | | 1 to 4 years | | | 5 or more years | | | Total | |
Long-term debt | | | | | $1,183,062 | | | $3,444,093 | | | $501,005,191 | | | $435,000,000 | | | $940,632,346 | |
Accrued interest | | | 4.98% | | | 17,700,067 | | | 21,144,641 | | | 143,645,742 | | | 46,594,158 | | | 229,084,608 |
| | | | $18,883,129 | | | $24,588,734 | | | $644,650,933 | | | $481,594,158 | | | $1,169,716,954 |
17.11 | Fair value of financial instruments |
17.11.1 | Fair value of financial assets that are measured at fair value on a recurring basis |
17.11.2 | Fair value of financial instruments carried at amortized cost |
18. | Transactions and balances with related parties |
| | December 31, 2022 | | | December 31, 2021 | |
Employee annual salary plus short-term benefits | | | $6,217,721 | | | $4,704,415 |
Share-based compensation expense (Note 19.3) | | | 6,650,487 | | | 5,554,353 |
| | $12,868,208 | | | $10,258,768 | |
Number of key executives | | | 21 | | | 23 |
19. | Share-based payments |
19.1 | Details of the share-based plans of the Entity |
i. | A trust was established in 2018 by the resolution of the general ordinary stockholders meeting |
ii. | The plan is share-based and is calculated by comparing Vesta's Total Relative Return, stock price appreciation, plus dividend payments over the preceding three years with the same metric calculated for our peers. Under the plan, if Vesta is at the median of the group, the Grant would be equal to the expected share grant; if Vesta is the worst performer, there would be no grant, and if Vesta is the best performer, the Grant would be 150% of the expected share amount. In addition, for some executives, a portion of their short-term annual cash bonus is granted as an additional stock bonus with an equity-plus premium of 20% additional shares. |
iii. | The Grant and the equity-plus are delivered to management over three years after the grant year, thus providing a solid executive retention tool. The granted shares are deposited to a Trust that manages the shares' delivery to the employees as per the schedules described above. |
iv. | The Shareholder Assembly of January 2015 assembly approved 10.4 million shares for the Vesta Vision 2020 LTI plan. In March 2020, the shareholder approved 13.8 million shares for the Level 3 LTI plan. |
| | | | | | | | | | | | Plan Parameters | ||||||||||||
Grant Year | | | Total Relative Return (*) | | | Shares granted in LTI | | | Equity Plus Guaranteed Shares | | | Cumulative Exercised Shares | | | Shares in trust | | | MIN | | | TARGET | | | MAX |
2015 | | | 0% | | | $— | | | $— | | | $— | | | $— | | | $— | | | 1,738,037 | | | 2,600,000 |
2016 | | | 55% | | | 863,499 | | | 483,826 | | | (1,347,325) | | | — | | | 695,215 | | | 1,738,037 | | | 2,607,056 |
2017 | | | 40% | | | 637,200 | | | 944,674 | | | (1,581,874) | | | — | | | 695,215 | | | 1,738,037 | | | 2,607,056 |
2018 | | | 145% | | | 3,423,106 | | | 753,372 | | | (4,176,478) | | | — | | | 1,000,000 | | | 2,500,000 | | | 3,750,000 |
2019 | | | 150% | | | 3,550,449 | | | 515,706 | | | (2,710,771) | | | 1,355,384 | | | 1,000,000 | | | 2,500,000 | | | 3,750,000 |
2020 | | | 150% | | | 3,707,949 | | | 520,493 | | | (1,409,480) | | | 2,818,962 | | | 1,000,000 | | | 2,500,000 | | | 3,750,000 |
2021 | | | 143% | | | 3,760,851 | | | 525,183 | | | (4,089) | | | 4,281,944 | | | 1,100,000 | | | 2,750,000 | | | 4,125,000 |
2022 | | | 143% | | | 3,763,449 | | | — | | | — | | | — | | | 1,100,000 | | | 2,750,000 | | | 4,125,000 |
Total | | | | | $19,706,503 | | | $3,743,254 | | | $(11,230,017) | | | $8,456,290 | | | | | | |
* | Calculated for the previous three years. |
19.2 | Fair value of share options granted in the year |
19.3 | Compensation expense recognized |
| | December 31, 2022 | | | December 31, 2021 | |
Vesta 20-20 Incentive Plan | | | $6,650,487 | | | $5,554,353 |
Total long-term incentive expense | | | $6,650,487 | | | $5,554,353 |
19.4 | Share awards outstanding at the end of the year |
20. | Litigation and commitments |
21. | Events after the reporting period |
22. | Approval of the financial statements |
Barclays | | | BofA Securities | | | Morgan Stanley |
Item 6. | Indemnification of Directors and Officers |
Item 7. | Recent Sales of Unregistered Securities |
Item 8. | Exhibits and Financial Statement Schedules |
(a) | Exhibits |
(b) | Financial Statement Schedules |
Item 9. | Undertakings |
(1) | That for purposes of determining any liability under the Securities Act, the information omitted from the form of prospectus filed as part of this registration statement in reliance upon Rule 430A and contained in a form of prospectus filed by the Company pursuant to Rule 424(b)(1) or (4), or 497(h) under the Securities Act shall be deemed to be part of this registration statement as of the time it was declared effective. |
(2) | For the purpose of determining any liability under the Securities Act, each post-effective amendment that contains a form of prospectus shall be deemed to be a new registration statement relating to the securities offered therein, and the offering of such securities at that time shall be deemed to be the initial bona fide offering thereof. |
Exhibit No. | | | Description of Exhibit |
| | Form of Underwriting Agreement. | |
| | ||
| | Amended and Restated Bylaws of Corporación Inmobiliaria Vesta, S.A.B. de C.V., dated March 30, 2023 (English translation) (incorporated herein by reference to Exhibit 3.1 to the Company’s Registration Statement on Form F-1 (File No. 333-272532 filed with the SEC on June 8, 2023)). | |
| | ||
| | Form of Deposit Agreement among Corporación Inmobiliaria Vesta, S.A.B. de C.V., Citibank, N.A., as Depositary, and all Owners and Holders from time to time of American Depositary Shares issued thereunder (incorporated herein by reference to Exhibit 4.1 to Amendment No. 1 to the Company’s Registration Statement on Form F-1 (File No. 333-272532 filed with the SEC on June 16, 2023)). | |
| | ||
| | Form of American Depositary Receipt (incorporated herein by reference to Exhibit 4.1 to Amendment No. 1 to the Company’s Registration Statement on Form F-1 (File No. 333-272532 filed with the SEC on June 16, 2023)). | |
| | ||
| | Loan agreement, dated July 27, 2016, among Vesta Bajío, S. de R.L. de C.V., Vesta Baja California, S. de R.L. de C.V., QVC, S. de R.L. de C.V., QVCII, S. de R.L. de C.V. and WTN Desarrollos Inmobiliarios de México, S. de R.L. de C.V., as borrowers, and Metropolitan Life Insurance Company, as lender (incorporated herein by reference to Exhibit 4.3 to the Company’s Registration Statement on Form F-1 (File No. 333-272532 filed with the SEC on June 8, 2023)). | |
| | ||
| | First amendment to loan agreement, dated March 22, 2018, among Vesta Bajío, S. de R.L. de C.V., Vesta Baja California, S. de R.L. de C.V., QVC, S. de R.L. de C.V., QVCII, S. de R.L. de C.V. and WTN Desarrollos Inmobiliarios de México, S. de R.L. de C.V. as borrowers, and Metropolitan Life Insurance Company, as lender (incorporated herein by reference to Exhibit 4.4 to the Company’s Registration Statement on Form F-1 (File No. 333-272532 filed with the SEC on June 8, 2023)). | |
| | ||
| | Guarantee agreement, dated September 22, 2017, among QVC, S. de R.L. de C.V., QVCII, S. de R.L. de C.V., Vesta Bajío, S. de R.L. de C.V., Vesta Baja California, S. de R.L. de C.V. and WTN Desarrollos Inmobiliarios de México, S. de R.L. de C.V., in relation to the issuance of certain 5.03% Series A Senior Notes due September 22, 2024 and 5.31% Series B Senior Notes due September 22, 2027 (incorporated herein by reference to Exhibit 4.5 to the Company’s Registration Statement on Form F-1 (File No. 333-272532 filed with the SEC on June 8, 2023)). | |
| | ||
| | Forms of 5.03% Series A Senior Notes due September 22, 2024, and 5.31% Series B Senior Notes due September 22, 2027 (incorporated herein by reference to Exhibit 4.6 to the Company’s Registration Statement on Form F-1 (File No. 333-272532 filed with the SEC on June 8, 2023)). | |
| | ||
| | Loan agreement, dated November 1, 2017, among Vesta Bajío, S. de R.L. de C.V., Vesta Baja California, S. de R.L. de C.V., QVC, S. de R.L. de C.V. and QVCII, S. de R.L. de C.V., as borrowers, and Metropolitan Life Insurance Company, as lender (incorporated herein by reference to Exhibit 4.7 to the Company’s Registration Statement on Form F-1 (File No. 333-272532 filed with the SEC on June 8, 2023)). | |
| | ||
| | Guarantee agreement, dated June 25, 2019, among QVC, S. de R.L. de C.V., QVCII, S. de R.L. de C.V., Vesta Bajío, S. de R.L. de C.V., Vesta Baja California, S. de R.L. de C.V. and WTN Desarrollos Inmobiliarios de México, S. de R.L. de C.V., in relation to the issuance of certain 5.18% Series C Senior Notes due June 14, 2029 and 5.28% Series D Senior Notes due June 14, 2031 (incorporated herein by reference to Exhibit 4.8 to the Company’s Registration Statement on Form F-1 (File No. 333-272532 filed with the SEC on June 8, 2023)). | |
| |
Exhibit No. | | | Description of Exhibit |
| | Forms of 5.18% Series C Senior Notes due June 14, 2029 and 5.28% Series D Senior Notes due June 14, 2031 (incorporated herein by reference to Exhibit 4.9 to the Company’s Registration Statement on Form F-1 (File No. 333-272532 filed with the SEC on June 8, 2023)). | |
| | ||
| | Indenture, dated May 13, 2021, among Corporación Inmobiliaria Vesta, S.A.B. de C.V., as issuer, QVC, S. de R.L. de C.V., QVCII, S. de R.L. de C.V., Vesta Bajío, S. de R.L. de C.V., Vesta Baja California, S. de R.L. de C.V. and WTN Desarrollos Inmobiliarios de México, S. de R.L. de C.V. , jointly as subsidiary guarantors, and The Bank of New York Mellon, as trustee, paying agent, registrar and transfer agent, in relation to the issuance of Corporación Inmobiliaria Vesta, S.A.B. de C.V.’s US$350,000,000 3.625% Senior Notes due 2031 (incorporated herein by reference to Exhibit 4.10 to the Company’s Registration Statement on Form F-1 (File No. 333-272532 filed with the SEC on June 8, 2023)). | |
| | ||
| | Sustainability-linked revolving credit agreement, dated August 31, 2022, among Corporación Inmobiliaria Vesta, S.A.B. de C.V., as borrower, various financial institutions and other persons from time to times parties to the agreement, as lenders, Banco Nacional de México, S.A., Integrante del Grupo Financiero Banamex, División Fiduciaria, as administrative agent, BBVA México, S.A., Institución de Banca Múltiple, Grupo Financiero BBVA México and The Bank of Nova Scotia, as sustainability agents, Banco Nacional de Comercio Exterior, S.N.C., I.B.D., BBVA México, S.A., Institución de Banca Múltiple, Grupo Financiero BBVA México, Banco Nacional de México, S.A., Integrante del Grupo Financiero Banamex, Scotiabank Inverlat, S.A., Institución de Banca Múltiple, Grupo Financiero Scotiabank Inverlat, as joint lead arrangers and joint bookrunners, and Banco Sabadell, S.A., Institución de Banca Múltiple, as mandated lead arranger (incorporated herein by reference to Exhibit 4.11 to the Company’s Registration Statement on Form F-1 (File No. 333-272532 filed with the SEC on June 8, 2023)). | |
| | ||
| | Opinion of Ritch, Mueller y Nicolau, S.C. | |
| | ||
| | List of the subsidiaries of the registrant. | |
| | ||
| | List of the subsidiary guarantors guaranteeing Corporación Inmobiliaria Vesta, S.A.B. de C.V.’s US$350,000,000 3.625% Senior Notes due 2031. | |
| | ||
| | Consent of Galaz, Yamazaki, Ruiz Urquiza, S.C., independent registered public accounting firm for Corporación Inmobiliaria Vesta, S.A.B. de C.V. | |
| | ||
| | Consent of Ritch, Mueller y Nicolau, S.C. (included in Exhibit 5.1). | |
| | ||
| | Power of Attorney (included on signature page of the registration statement). | |
| | ||
| | Consent of Cushman & Wakefield, S. de R.L. de C.V. | |
| | ||
| | Consent of LaSalle Partners, S. de R.L. de C.V. | |
| | ||
| | Consent of CBRE, S.A. de C.V. | |
| | ||
| | Filing Fee Table. |
* | Previously filed. |
| | Corporación Inmobiliaria Vesta, S.A.B. de C.V. | |||||||
| | | | | | ||||
| | By: | | | /s/ Lorenzo Dominique Berho Carranza | ||||
| | | | Name: | | | Lorenzo Dominique Berho Carranza | ||
| | | | Title: | | | Chief Executive Officer | ||
| | | | | | ||||
| | By: | | | /s/ Juan Felipe Sottil Achutegui | ||||
| | | | Name: | | | Juan Felipe Sottil Achutegui | ||
| | | | Title: | | | Chief Financial Officer |
Signature | | | Title | | | Date |
| | | | |||
/s/ Lorenzo Dominique Berho Carranza | | | Chief Executive Officer (principal executive officer) | | | December 5, 2023 |
Lorenzo Dominique Berho Carranza | | |||||
| | | | |||
/s/ Juan Felipe Sottil Achutegui | | | Chief Financial Officer (principal financial officer and principal accounting officer) | | | December 5, 2023 |
Juan Felipe Sottil Achutegui | | |||||
| | | | |||
/s/ Lorenzo Manuel Berho Corona | | | Chairman of the Board of Directors | | | December 5, 2023 |
Lorenzo Manuel Berho Corona | | |||||
| | | | |||
/s/ Stephen B. Williams | | | Director | | | December 5, 2023 |
Stephen B. Williams | | |||||
| | | | |||
/s/ José Manuel Domínguez Díaz Ceballos | | | Director | | | December 5, 2023 |
José Manuel Domínguez Díaz Ceballos | | |||||
| | | | |||
/s/ Craig Wieland | | | Director | | | December 5, 2023 |
Craig Wieland | | |||||
| | | | |||
/s/ Luis Javier Solloa Hernández | | | Director | | | December 5, 2023 |
Luis Javier Solloa Hernández | | |||||
| | | | |||
/s/ Loreanne Helena García Ottati | | | Director | | | December 5, 2023 |
Loreanne Helena García Ottati | | |||||
| | | | |||
| | Director | | | ||
Oscar Francisco Cázares Elías | | |||||
| | | | |||
/s/ Daniela Berho Carranza | | | Director | | | December 5, 2023 |
Daniela Berho Carranza | | |||||
| | | | |||
/s/ Douglas M. Arthur | | | Director | | | December 5, 2023 |
Douglas M. Arthur | | |||||
| | | | |||
| | Director | | | ||
Luis de la Calle Pardo | |
COGENCY GLOBAL INC. | | | ||||
| | | | |||
By: /s/ Colleen A. De Vries | | | ||||
Name: | | | Colleen A. De Vries | | | |
Title: | | | Senior Vice-President on behalf of Cogency Global Inc. | | |